Estimated Value: $410,000 - $429,216
2
Beds
2
Baths
1,056
Sq Ft
$397/Sq Ft
Est. Value
About This Home
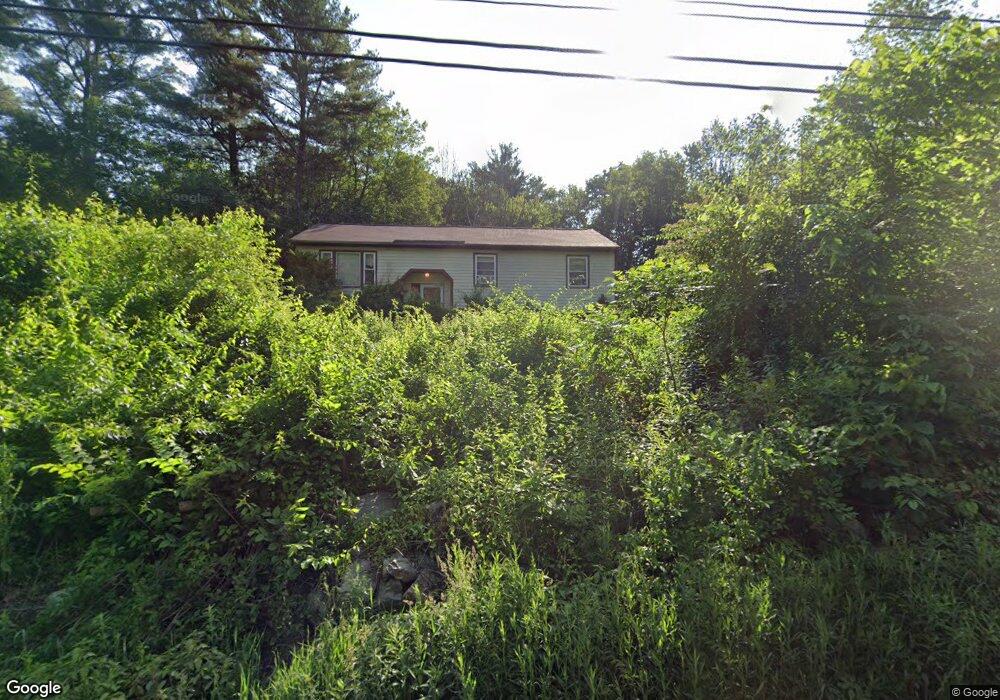
This home is located at 189 Bypass 28, Derry, NH 03038 and is currently estimated at $418,804, approximately $396 per square foot. 189 Bypass 28 is a home located in Rockingham County with nearby schools including Ernest P. Barka Elementary School, Gilbert H. Hood Middle School, and Pinkerton Academy.
Ownership History
Date
Name
Owned For
Owner Type
Purchase Details
Closed on
Dec 1, 1998
Sold by
Decarolis Eric S
Bought by
Chepulis Christopher P
Current Estimated Value
Home Financials for this Owner
Home Financials are based on the most recent Mortgage that was taken out on this home.
Original Mortgage
$78,600
Outstanding Balance
$17,931
Interest Rate
6.83%
Estimated Equity
$400,873
Purchase Details
Closed on
Mar 25, 1997
Sold by
Estes Michael D and Estes Betty J
Bought by
Decarolis Erin B and Decarolis Eric S
Home Financials for this Owner
Home Financials are based on the most recent Mortgage that was taken out on this home.
Original Mortgage
$64,928
Interest Rate
7.68%
Create a Home Valuation Report for This Property
The Home Valuation Report is an in-depth analysis detailing your home's value as well as a comparison with similar homes in the area
Home Values in the Area
Average Home Value in this Area
Purchase History
| Date | Buyer | Sale Price | Title Company |
|---|---|---|---|
| Chepulis Christopher P | $84,900 | -- | |
| Decarolis Erin B | $65,000 | -- |
Source: Public Records
Mortgage History
| Date | Status | Borrower | Loan Amount |
|---|---|---|---|
| Open | Decarolis Erin B | $78,600 | |
| Previous Owner | Decarolis Erin B | $64,928 |
Source: Public Records
Tax History Compared to Growth
Tax History
| Year | Tax Paid | Tax Assessment Tax Assessment Total Assessment is a certain percentage of the fair market value that is determined by local assessors to be the total taxable value of land and additions on the property. | Land | Improvement |
|---|---|---|---|---|
| 2024 | $6,313 | $337,800 | $199,400 | $138,400 |
| 2023 | $6,045 | $292,300 | $169,500 | $122,800 |
| 2022 | $5,569 | $292,500 | $169,500 | $123,000 |
| 2021 | $5,465 | $220,700 | $129,500 | $91,200 |
| 2020 | $12,203 | $220,700 | $129,500 | $91,200 |
| 2019 | $88 | $181,100 | $99,900 | $81,200 |
| 2018 | $4,729 | $181,100 | $99,900 | $81,200 |
| 2017 | $98 | $158,900 | $90,400 | $68,500 |
| 2016 | $4,300 | $158,900 | $90,400 | $68,500 |
| 2015 | $4,443 | $152,000 | $90,400 | $61,600 |
| 2014 | $4,472 | $152,000 | $90,400 | $61,600 |
| 2013 | $4,412 | $140,100 | $82,800 | $57,300 |
Source: Public Records
Map
Nearby Homes