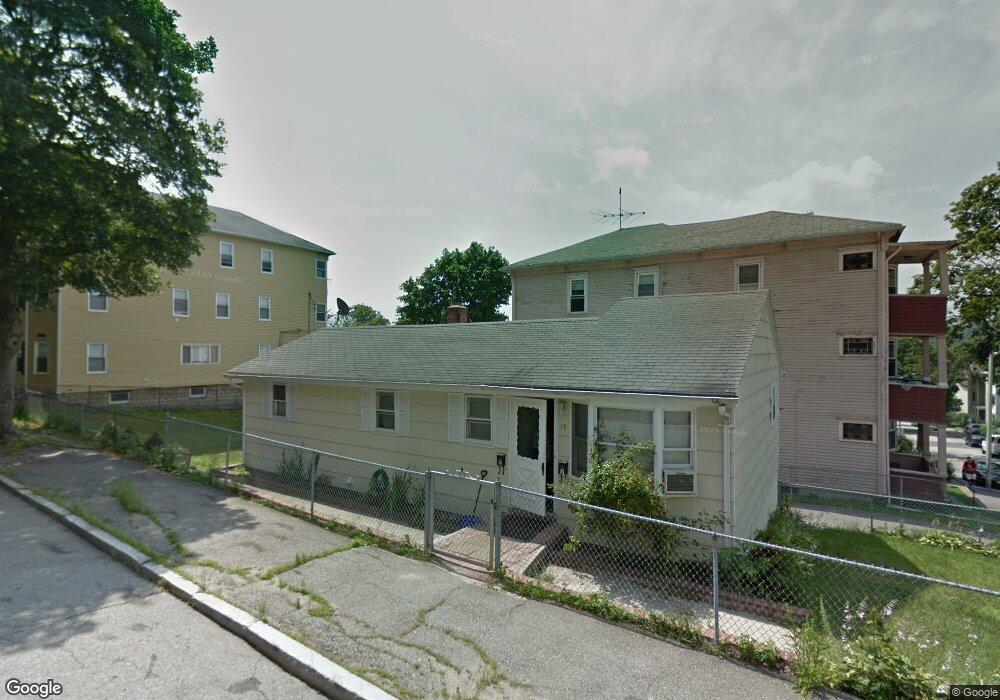
19 Lund St Worcester, MA 01607
Vernon Hill NeighborhoodEstimated Value: $292,129 - $330,000
2
Beds
1
Bath
916
Sq Ft
$342/Sq Ft
Est. Value
About This Home
This home is located at 19 Lund St, Worcester, MA 01607 and is currently estimated at $313,532, approximately $342 per square foot. 19 Lund St is a home located in Worcester County with nearby schools including Vernon Hill Elementary School, Jacob Hiatt Magnet School, and Chandler Magnet.
Ownership History
Date
Name
Owned For
Owner Type
Purchase Details
Closed on
Oct 30, 2002
Sold by
Osborne Kurt and Osborne Nancy A
Bought by
Tamayo Oscar and Tamayo Marleni
Current Estimated Value
Purchase Details
Closed on
Sep 18, 1998
Sold by
Hayes Marilyn A
Bought by
Osborne Kurt and Obsorne Nancy A
Home Financials for this Owner
Home Financials are based on the most recent Mortgage that was taken out on this home.
Original Mortgage
$83,231
Interest Rate
6.9%
Mortgage Type
Purchase Money Mortgage
Create a Home Valuation Report for This Property
The Home Valuation Report is an in-depth analysis detailing your home's value as well as a comparison with similar homes in the area
Home Values in the Area
Average Home Value in this Area
Purchase History
| Date | Buyer | Sale Price | Title Company |
|---|---|---|---|
| Tamayo Oscar | $139,900 | -- | |
| Osborne Kurt | $82,900 | -- |
Source: Public Records
Mortgage History
| Date | Status | Borrower | Loan Amount |
|---|---|---|---|
| Previous Owner | Osborne Kurt | $83,231 | |
| Previous Owner | Osborne Kurt | $50,000 |
Source: Public Records
Tax History
| Year | Tax Paid | Tax Assessment Tax Assessment Total Assessment is a certain percentage of the fair market value that is determined by local assessors to be the total taxable value of land and additions on the property. | Land | Improvement |
|---|---|---|---|---|
| 2025 | $2,754 | $208,800 | $81,200 | $127,600 |
| 2024 | $2,712 | $197,200 | $81,200 | $116,000 |
| 2023 | $2,603 | $181,500 | $70,600 | $110,900 |
| 2022 | $2,294 | $150,800 | $56,500 | $94,300 |
| 2021 | $2,348 | $144,200 | $45,200 | $99,000 |
| 2020 | $2,300 | $135,300 | $44,900 | $90,400 |
| 2019 | $2,230 | $123,900 | $39,200 | $84,700 |
| 2018 | $2,163 | $114,400 | $39,200 | $75,200 |
| 2017 | $2,166 | $112,700 | $39,200 | $73,500 |
| 2016 | $2,135 | $103,600 | $28,300 | $75,300 |
| 2015 | $2,079 | $103,600 | $28,300 | $75,300 |
| 2014 | $2,024 | $103,600 | $28,300 | $75,300 |
Source: Public Records
Map
Nearby Homes
- 7 Lund St
- 6 Lund St
- 74 Esther St
- 32 Ames St
- 9 1/2 Ames St Unit 2
- 17 Fairbanks St
- 26 Maxwell St
- 93 Fairfax Rd
- 4 Maxwell Ct
- 3A Gediminas St
- 172 Perry Ave Unit 1A
- 172 Perry Ave Unit 2B
- 20 Bolton St
- 41 Bridgeport St
- 13 Sterling St
- 32 Granite St
- 9 Winthrop St
- 607 Cambridge St Unit 4
- 195 Millbury St
- 26 South St
Your Personal Tour Guide
Ask me questions while you tour the home.