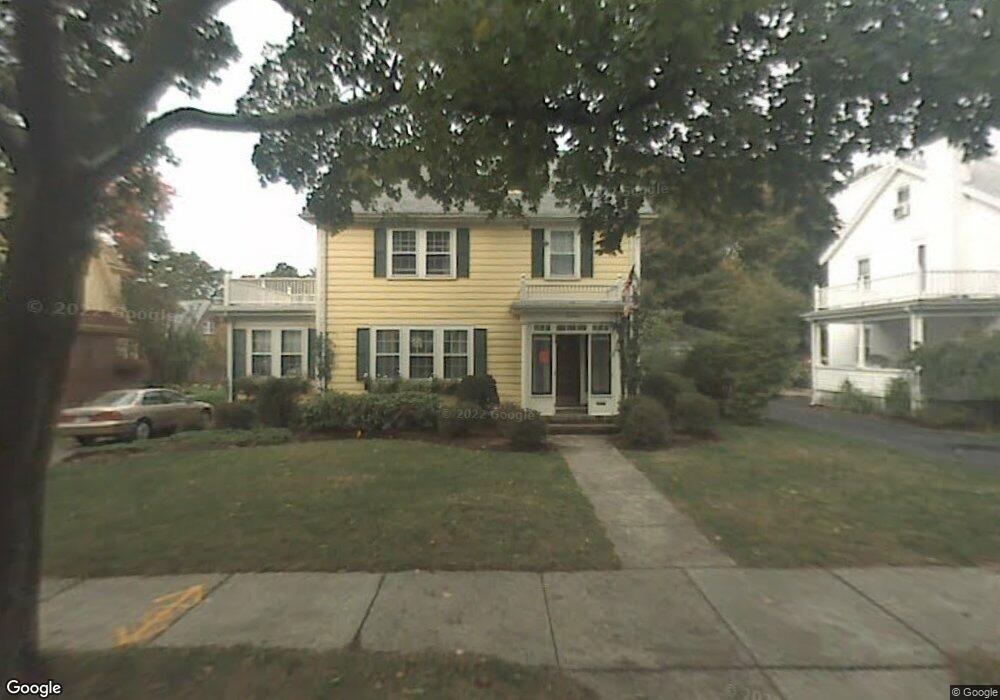
19 Rangeley Rd West Newton, MA 02465
West Newton NeighborhoodEstimated Value: $1,304,000 - $2,034,000
4
Beds
3
Baths
2,695
Sq Ft
$592/Sq Ft
Est. Value
About This Home
This home is located at 19 Rangeley Rd, West Newton, MA 02465 and is currently estimated at $1,596,412, approximately $592 per square foot. 19 Rangeley Rd is a home located in Middlesex County with nearby schools including Franklin Elementary School, F.A. Day Middle School, and Newton North High School.
Ownership History
Date
Name
Owned For
Owner Type
Purchase Details
Closed on
May 31, 1990
Sold by
Johnson Myrtle H
Bought by
Drake Joseph P
Current Estimated Value
Create a Home Valuation Report for This Property
The Home Valuation Report is an in-depth analysis detailing your home's value as well as a comparison with similar homes in the area
Home Values in the Area
Average Home Value in this Area
Purchase History
| Date | Buyer | Sale Price | Title Company |
|---|---|---|---|
| Drake Joseph P | $205,000 | -- |
Source: Public Records
Mortgage History
| Date | Status | Borrower | Loan Amount |
|---|---|---|---|
| Closed | Drake Joseph P | $161,000 |
Source: Public Records
Tax History Compared to Growth
Tax History
| Year | Tax Paid | Tax Assessment Tax Assessment Total Assessment is a certain percentage of the fair market value that is determined by local assessors to be the total taxable value of land and additions on the property. | Land | Improvement |
|---|---|---|---|---|
| 2025 | $12,744 | $1,300,400 | $823,200 | $477,200 |
| 2024 | $12,328 | $1,263,100 | $799,200 | $463,900 |
| 2023 | $11,714 | $1,150,700 | $606,400 | $544,300 |
| 2022 | $11,209 | $1,065,500 | $561,500 | $504,000 |
| 2021 | $10,816 | $1,005,200 | $529,700 | $475,500 |
| 2020 | $10,494 | $1,005,200 | $529,700 | $475,500 |
| 2019 | $10,198 | $975,900 | $514,300 | $461,600 |
| 2018 | $9,899 | $914,900 | $465,300 | $449,600 |
| 2017 | $9,598 | $863,100 | $439,000 | $424,100 |
| 2016 | $9,179 | $806,600 | $410,300 | $396,300 |
| 2015 | $8,752 | $753,800 | $383,500 | $370,300 |
Source: Public Records
Map
Nearby Homes
- 53-55 N Gate Park
- 41 Kilburn Rd
- 75 Cherry St
- 287 Cherry St Unit 2
- 76 Harding St
- 76 Taft Ave Unit 1
- 76 Taft Ave
- 76 Taft Ave Unit 2
- 44 Westland Ave
- 56 Dearborn St
- 106 River St Unit 18
- 106 River St Unit 2
- 106 River St Unit 14
- 97 North St
- 2 Elm St Unit 6
- 2 Elm St Unit 8
- 371 Cherry St
- 321 Albemarle Rd
- 27 Cross St Unit 27
- 33 Joseph Rd