Estimated Value: $439,556 - $479,000
3
Beds
2
Baths
1,318
Sq Ft
$347/Sq Ft
Est. Value
About This Home
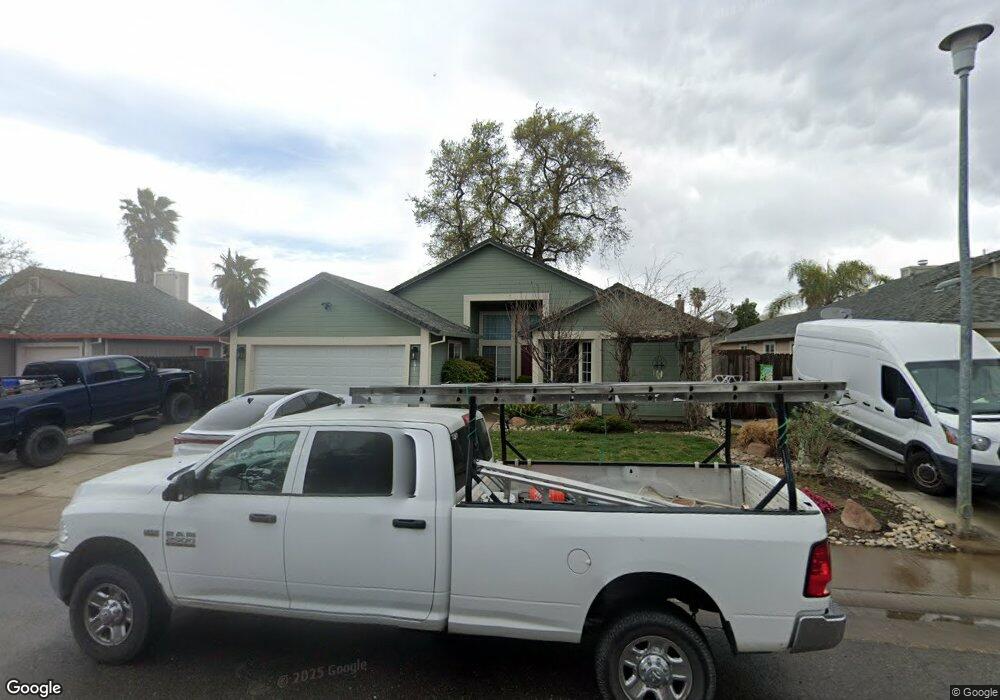
This home is located at 191 Rio Mesa Way, Galt, CA 95632 and is currently estimated at $457,639, approximately $347 per square foot. 191 Rio Mesa Way is a home located in Sacramento County with nearby schools including Vernon E. Greer Elementary School, Robert L. McCaffrey Middle School, and Galt High School.
Ownership History
Date
Name
Owned For
Owner Type
Purchase Details
Closed on
Dec 22, 2021
Sold by
Word Alicia and Ehrlich Alicia
Bought by
Word Levi and Word Alicia
Current Estimated Value
Home Financials for this Owner
Home Financials are based on the most recent Mortgage that was taken out on this home.
Original Mortgage
$168,000
Outstanding Balance
$154,516
Interest Rate
3.11%
Mortgage Type
New Conventional
Estimated Equity
$303,123
Purchase Details
Closed on
Jul 28, 2011
Sold by
Federal National Mortgage Association
Bought by
Ehrlich Alicia
Home Financials for this Owner
Home Financials are based on the most recent Mortgage that was taken out on this home.
Original Mortgage
$153,886
Interest Rate
4.46%
Mortgage Type
New Conventional
Purchase Details
Closed on
Mar 7, 2011
Sold by
Hustrulid Nicholas E
Bought by
Federal National Mortgage Association
Purchase Details
Closed on
Jan 22, 2008
Sold by
Hustrulid Nicholas E and Hustrulid Maria A
Bought by
Hustrulid Nicholas E
Purchase Details
Closed on
Jun 23, 2006
Sold by
Hustrulid Nicholas E
Bought by
Hustrulid Maria A
Home Financials for this Owner
Home Financials are based on the most recent Mortgage that was taken out on this home.
Original Mortgage
$308,000
Interest Rate
6.87%
Mortgage Type
Purchase Money Mortgage
Purchase Details
Closed on
May 15, 2003
Sold by
Pierson Michael D and Pierson Katie M
Bought by
Hustrulid Nicholas E and Hustrulid Maria A
Home Financials for this Owner
Home Financials are based on the most recent Mortgage that was taken out on this home.
Original Mortgage
$173,600
Interest Rate
6.5%
Mortgage Type
Purchase Money Mortgage
Purchase Details
Closed on
Mar 19, 1998
Sold by
Primasing Kevin R and Primasing Shannon M
Bought by
Pierson Michael D and Pierson Katie N
Home Financials for this Owner
Home Financials are based on the most recent Mortgage that was taken out on this home.
Original Mortgage
$103,683
Interest Rate
7.06%
Mortgage Type
FHA
Create a Home Valuation Report for This Property
The Home Valuation Report is an in-depth analysis detailing your home's value as well as a comparison with similar homes in the area
Home Values in the Area
Average Home Value in this Area
Purchase History
| Date | Buyer | Sale Price | Title Company |
|---|---|---|---|
| Word Levi | -- | Old Republic Title Company | |
| Ehrlich Alicia | $148,500 | Lawyers Title Insurance Corp | |
| Federal National Mortgage Association | $102,600 | Landsafe Title | |
| Hustrulid Nicholas E | -- | None Available | |
| Hustrulid Maria A | -- | North American Title Co | |
| Hustrulid Nicholas E | -- | North American Title Co | |
| Hustrulid Nicholas E | $217,000 | Chicago Title Co | |
| Pierson Michael D | $108,000 | Commonwealth Land Title Co |
Source: Public Records
Mortgage History
| Date | Status | Borrower | Loan Amount |
|---|---|---|---|
| Open | Word Levi | $168,000 | |
| Closed | Ehrlich Alicia | $153,886 | |
| Previous Owner | Hustrulid Nicholas E | $308,000 | |
| Previous Owner | Hustrulid Nicholas E | $173,600 | |
| Previous Owner | Pierson Michael D | $103,683 | |
| Closed | Hustrulid Nicholas E | $43,400 |
Source: Public Records
Tax History
| Year | Tax Paid | Tax Assessment Tax Assessment Total Assessment is a certain percentage of the fair market value that is determined by local assessors to be the total taxable value of land and additions on the property. | Land | Improvement |
|---|---|---|---|---|
| 2025 | $2,219 | $186,509 | $75,357 | $111,152 |
| 2024 | $2,219 | $182,853 | $73,880 | $108,973 |
| 2023 | $2,184 | $179,269 | $72,432 | $106,837 |
| 2022 | $2,103 | $175,755 | $71,012 | $104,743 |
| 2021 | $2,398 | $172,310 | $69,620 | $102,690 |
| 2020 | $2,382 | $170,545 | $68,907 | $101,638 |
| 2019 | $2,334 | $167,202 | $67,556 | $99,646 |
| 2018 | $2,331 | $163,925 | $66,232 | $97,693 |
| 2017 | $2,258 | $160,712 | $64,934 | $95,778 |
| 2016 | $2,187 | $157,561 | $63,661 | $93,900 |
| 2015 | $2,128 | $155,195 | $62,705 | $92,490 |
| 2014 | $2,124 | $152,156 | $61,477 | $90,679 |
Source: Public Records
Map
Nearby Homes
- 214 Cinnamon Dr
- 0 B St Unit 226013319
- 105 Kent St
- 240 3rd St
- 14076 Saradale Ln
- 700 2nd St Unit 40
- 700 2nd St Unit 14
- 323 Emerald Oak Dr
- 229 Sandpiper Dr
- 83 Sunshine Dr
- 150 Spruce Ave
- 667 Germaine Dr
- 402 Alpen Rose Way
- 515 E St
- 14130 Sargent Ave
- 232 Oak Ave
- 246 Oak Ave
- 712 Church St
- Plan 1609 at Elliott Ranch - Sage
- Plan 2290 at Elliott Ranch - Willow
Your Personal Tour Guide
Ask me questions while you tour the home.