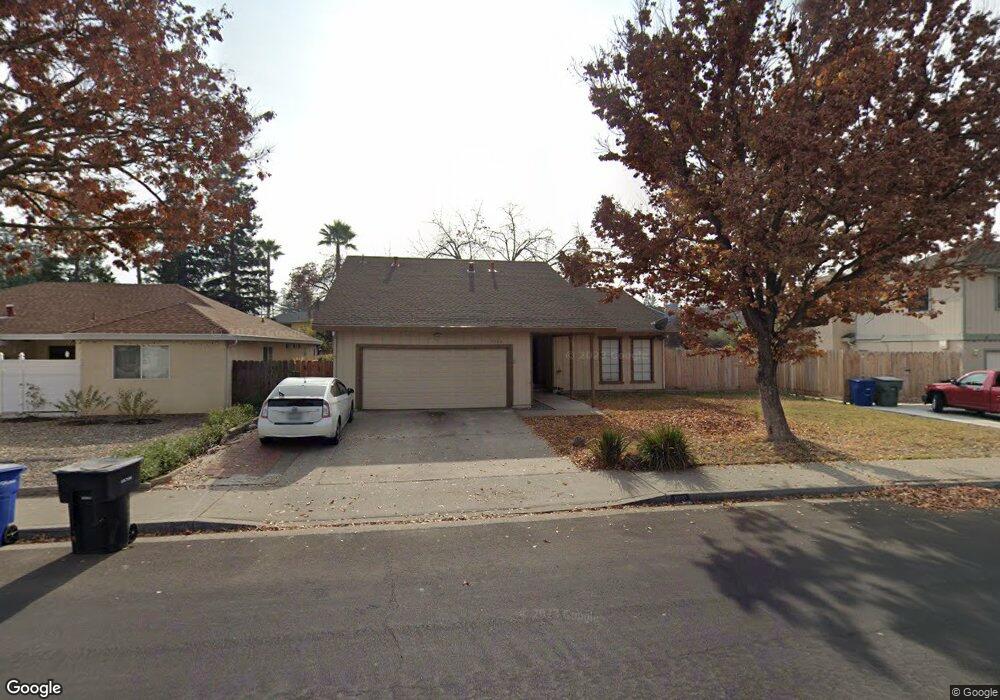
1920 Cheyenne Way Modesto, CA 95356
Estimated Value: $304,000 - $477,000
2
Beds
2
Baths
1,615
Sq Ft
$256/Sq Ft
Est. Value
About This Home
This home is located at 1920 Cheyenne Way, Modesto, CA 95356 and is currently estimated at $413,650, approximately $256 per square foot. 1920 Cheyenne Way is a home located in Stanislaus County with nearby schools including Agnes M. Baptist Elementary School, Prescott Junior High School, and Grace M. Davis High School.
Ownership History
Date
Name
Owned For
Owner Type
Purchase Details
Closed on
Dec 14, 2012
Sold by
Su Ching Yu and Wang Tzu Yi
Bought by
Su Ching Yu and Wang Tzu Yi
Current Estimated Value
Purchase Details
Closed on
Jan 24, 2003
Sold by
Su Ching Yu
Bought by
Su Ching Yu and Wang Tzu Yi
Home Financials for this Owner
Home Financials are based on the most recent Mortgage that was taken out on this home.
Original Mortgage
$164,000
Outstanding Balance
$69,381
Interest Rate
6.03%
Mortgage Type
Stand Alone First
Estimated Equity
$344,269
Purchase Details
Closed on
Dec 18, 2002
Sold by
Jacobson Carolyn
Bought by
Su Ching Yu
Home Financials for this Owner
Home Financials are based on the most recent Mortgage that was taken out on this home.
Original Mortgage
$164,000
Outstanding Balance
$69,381
Interest Rate
6.03%
Mortgage Type
Stand Alone First
Estimated Equity
$344,269
Create a Home Valuation Report for This Property
The Home Valuation Report is an in-depth analysis detailing your home's value as well as a comparison with similar homes in the area
Home Values in the Area
Average Home Value in this Area
Purchase History
| Date | Buyer | Sale Price | Title Company |
|---|---|---|---|
| Su Ching Yu | -- | None Available | |
| Su Ching Yu | -- | -- | |
| Su Ching Yu | $205,000 | Fidelity National Title | |
| Su Ching Yu | -- | Fidelity National Title |
Source: Public Records
Mortgage History
| Date | Status | Borrower | Loan Amount |
|---|---|---|---|
| Open | Su Ching Yu | $164,000 |
Source: Public Records
Tax History Compared to Growth
Tax History
| Year | Tax Paid | Tax Assessment Tax Assessment Total Assessment is a certain percentage of the fair market value that is determined by local assessors to be the total taxable value of land and additions on the property. | Land | Improvement |
|---|---|---|---|---|
| 2025 | $3,422 | $296,883 | $72,403 | $224,480 |
| 2024 | $3,301 | $291,063 | $70,984 | $220,079 |
| 2023 | $3,241 | $285,357 | $69,593 | $215,764 |
| 2022 | $3,153 | $279,763 | $68,229 | $211,534 |
| 2021 | $2,980 | $274,279 | $66,892 | $207,387 |
| 2020 | $2,941 | $271,468 | $66,207 | $205,261 |
| 2019 | $2,906 | $266,146 | $64,909 | $201,237 |
| 2018 | $2,871 | $260,929 | $63,637 | $197,292 |
| 2017 | $2,804 | $255,814 | $62,390 | $193,424 |
| 2016 | $2,591 | $238,000 | $70,000 | $168,000 |
| 2015 | $2,548 | $232,500 | $62,000 | $170,500 |
| 2014 | $2,234 | $202,000 | $35,000 | $167,000 |
Source: Public Records
Map
Nearby Homes
- 1905 Shell Ct
- 3601 Agate Dr
- 3612 Shawnee Dr
- 1936 Middelburg Ct
- 1712 Patton Dr
- 1837 Mark Mead Ln
- 1620 Carlisle Ave
- 2153 Cheyenne Way
- 3913 Jane Way
- 2256 Camborne Dr
- 2244 Southport Ln
- 2200 Arnhem Place
- 1612 Bellevue Ct
- 2124 Key West Ln
- 4209 Keepsake Ct
- 3109 Pembroke Dr
- 3808 Longbridge Dr
- 2308 van Der Goes Way
- 2224 Northridge Dr
- 3141 Lisa Dr
- 1916 Cheyenne Way
- 1924 Cheyenne Way
- 1901 Shell Ct
- 1928 Cheyenne Way
- 1909 Shell Ct
- 1925 Cheyenne Way
- 1912 Cheyenne Way
- 3625 Agate Dr
- 3624 Doheny Way
- 1917 Cheyenne Way
- 3621 Agate Dr
- 1913 Shell Ct
- 2001 Cheyenne Way
- 3704 Chippewa St
- 1913 Cheyenne Way
- 3620 Doheny Way
- 1900 Shell Ct
- 3617 Agate Dr
- 1904 Shell Ct
- 1917 Shell Ct