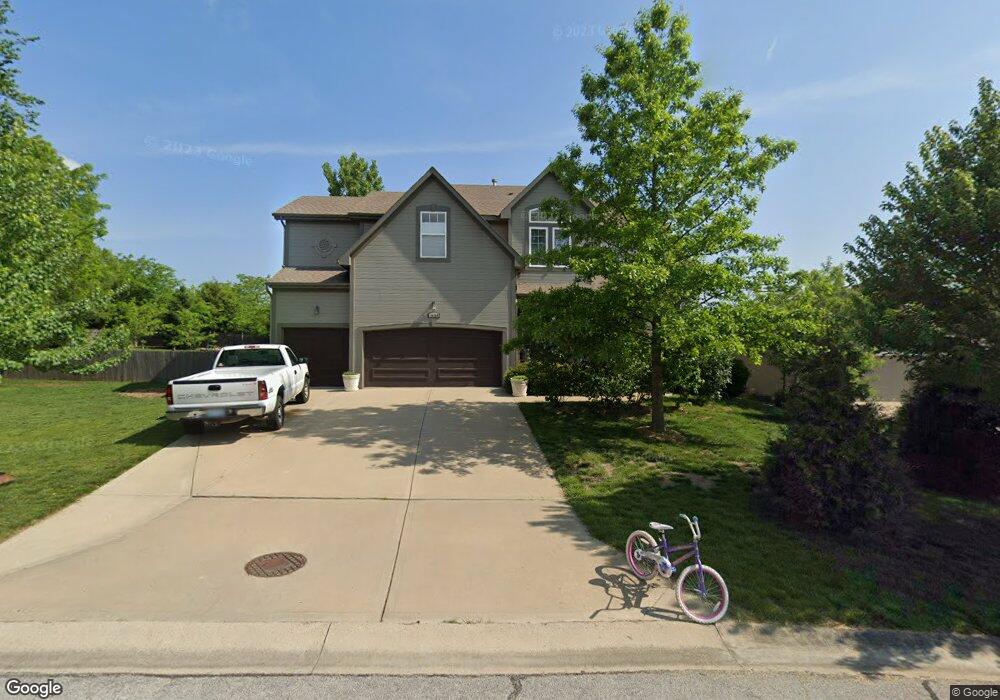
19360 W 105th St Olathe, KS 66061
Estimated Value: $588,508 - $660,000
4
Beds
4
Baths
2,904
Sq Ft
$211/Sq Ft
Est. Value
About This Home
This home is located at 19360 W 105th St, Olathe, KS 66061 and is currently estimated at $613,127, approximately $211 per square foot. 19360 W 105th St is a home located in Johnson County with nearby schools including Meadow Lane Elementary School, Prairie Trail Middle School, and Olathe Northwest High School.
Ownership History
Date
Name
Owned For
Owner Type
Purchase Details
Closed on
Aug 20, 2025
Sold by
Schaffer Chad E and Schaffer Ambria J
Bought by
Ambria J Schaffer Revocable Trust and Schaffer
Current Estimated Value
Purchase Details
Closed on
Sep 12, 2006
Sold by
Heartland Investments Llc
Bought by
Schaffer Chad E and Schaffer Ambria J
Home Financials for this Owner
Home Financials are based on the most recent Mortgage that was taken out on this home.
Original Mortgage
$255,480
Interest Rate
6.47%
Mortgage Type
New Conventional
Purchase Details
Closed on
Apr 26, 2006
Sold by
Heartland Investments L L C
Bought by
Jones Jerry and Jones Barbara
Purchase Details
Closed on
Jan 10, 2005
Sold by
Brittany Development Inc
Bought by
Heartland Investments Llc
Create a Home Valuation Report for This Property
The Home Valuation Report is an in-depth analysis detailing your home's value as well as a comparison with similar homes in the area
Home Values in the Area
Average Home Value in this Area
Purchase History
| Date | Buyer | Sale Price | Title Company |
|---|---|---|---|
| Ambria J Schaffer Revocable Trust | -- | None Listed On Document | |
| Ambria J Schaffer Revocable Trust | -- | None Listed On Document | |
| Schaffer Chad E | -- | Homestead Title | |
| Heartland Investments Llc | -- | Homestead Title | |
| Jones Jerry | -- | First American Title Ins Co | |
| Heartland Investments Llc | -- | Homestead Title |
Source: Public Records
Mortgage History
| Date | Status | Borrower | Loan Amount |
|---|---|---|---|
| Previous Owner | Heartland Investments Llc | $255,480 |
Source: Public Records
Tax History Compared to Growth
Tax History
| Year | Tax Paid | Tax Assessment Tax Assessment Total Assessment is a certain percentage of the fair market value that is determined by local assessors to be the total taxable value of land and additions on the property. | Land | Improvement |
|---|---|---|---|---|
| 2024 | $6,880 | $59,478 | $11,992 | $47,486 |
| 2023 | $6,546 | $56,764 | $9,493 | $47,271 |
| 2022 | $5,701 | $48,150 | $8,258 | $39,892 |
| 2021 | $5,611 | $45,253 | $7,504 | $37,749 |
| 2020 | $5,421 | $43,332 | $7,504 | $35,828 |
| 2019 | $5,102 | $40,526 | $6,256 | $34,270 |
| 2018 | $5,170 | $40,768 | $6,256 | $34,512 |
| 2017 | $4,970 | $38,789 | $5,684 | $33,105 |
| 2016 | $4,206 | $33,707 | $4,942 | $28,765 |
| 2015 | $4,164 | $33,385 | $4,942 | $28,443 |
| 2013 | -- | $30,591 | $5,716 | $24,875 |
Source: Public Records
Map
Nearby Homes
- 19576 W 105th Terrace
- 20035 W 107th Terrace
- 10012 Millstone Dr
- 18932 W 100th St
- 20457 W 107th Terrace
- 9835 Walker St
- 19220 W 98th Terrace
- 9844 Stevenson St
- 10744 S Palisade St
- 9917 Fountain Cir
- 18804 W 99th St
- 20802 W 102nd St
- 9915 Brockway St
- Jefferson 1.5 EX Plan at Cedar Ridge Reserve - Cedar Ridge
- Augusta Ex Plan at Cedar Ridge Reserve - Cedar Ridge
- Augusta II Plan at Cedar Ridge Reserve - Cedar Ridge
- Riviera Plan at Cedar Ridge Reserve - Cedar Ridge
- Roosevelt SE Plan at Cedar Ridge Reserve - Cedar Ridge
- Fillmore Plan at Cedar Ridge Reserve - Cedar Ridge
- Augusta Plan at Cedar Ridge Reserve - Cedar Ridge
- 19340 W 105th St
- 19420 W 105th St
- 19320 W 105th St
- 19365 W 105th St
- 19385 W 105th St
- 19325 W 105th St
- 19425 W 105th St
- 19345 W 105th St
- 10549 S Millstone Dr
- 10539 S Millstone Dr
- 10490 S Millstone Dr
- 10559 S Millstone Dr
- 10510 S Millstone Dr
- 10520 S Millstone Dr
- 10569 S Millstone Dr
- 10540 S Millstone Dr
- 19542 W 105th St
- 10579 S Millstone Dr
- 10560 S Millstone Dr
- 10589 S Millstone Dr