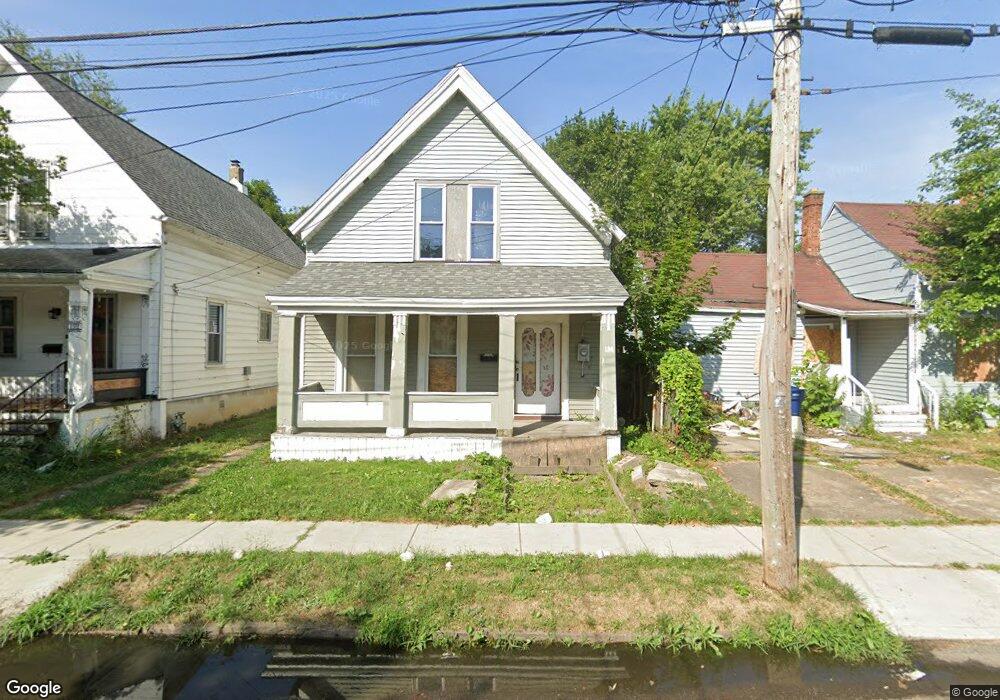
194 Gorton St Buffalo, NY 14207
Black Rock NeighborhoodEstimated Value: $85,000 - $158,000
3
Beds
2
Baths
1,584
Sq Ft
$78/Sq Ft
Est. Value
About This Home
This home is located at 194 Gorton St, Buffalo, NY 14207 and is currently estimated at $123,660, approximately $78 per square foot. 194 Gorton St is a home located in Erie County with nearby schools including Tapestry Charter School.
Ownership History
Date
Name
Owned For
Owner Type
Purchase Details
Closed on
Oct 11, 2022
Sold by
Ahmed Letu
Bought by
Dnm Home Improvement Llc
Current Estimated Value
Purchase Details
Closed on
Jul 12, 2022
Sold by
Enterprises Of Buffalo Llc
Bought by
Ahmed Letu
Purchase Details
Closed on
Oct 11, 2018
Sold by
County Of Erie
Bought by
Bennett Enterprises Of Buffalo Llc
Purchase Details
Closed on
Jul 10, 2015
Sold by
Wny Realty Development Llc
Bought by
Coram Derrick
Purchase Details
Closed on
Dec 20, 2011
Sold by
Tapia Mary J
Bought by
Wny Realty Development Llc
Create a Home Valuation Report for This Property
The Home Valuation Report is an in-depth analysis detailing your home's value as well as a comparison with similar homes in the area
Home Values in the Area
Average Home Value in this Area
Purchase History
| Date | Buyer | Sale Price | Title Company |
|---|---|---|---|
| Dnm Home Improvement Llc | $20,000 | None Available | |
| Ahmed Letu | -- | None Available | |
| Bennett Enterprises Of Buffalo Llc | $15,000 | None Available | |
| Coram Derrick | -- | None Available | |
| Wny Realty Development Llc | -- | None Available |
Source: Public Records
Tax History Compared to Growth
Tax History
| Year | Tax Paid | Tax Assessment Tax Assessment Total Assessment is a certain percentage of the fair market value that is determined by local assessors to be the total taxable value of land and additions on the property. | Land | Improvement |
|---|---|---|---|---|
| 2024 | $127 | $25,000 | $4,000 | $21,000 |
| 2023 | $127 | $25,000 | $4,000 | $21,000 |
| 2022 | $126 | $25,000 | $4,000 | $21,000 |
| 2021 | $126 | $25,000 | $4,000 | $21,000 |
| 2020 | $246 | $25,000 | $4,000 | $21,000 |
| 2019 | $878 | $32,000 | $3,900 | $28,100 |
| 2018 | $826 | $32,000 | $3,900 | $28,100 |
| 2017 | $190 | $32,000 | $3,900 | $28,100 |
| 2016 | $779 | $32,000 | $3,900 | $28,100 |
| 2015 | -- | $32,000 | $3,900 | $28,100 |
| 2014 | -- | $32,000 | $3,900 | $28,100 |
Source: Public Records
Map
Nearby Homes