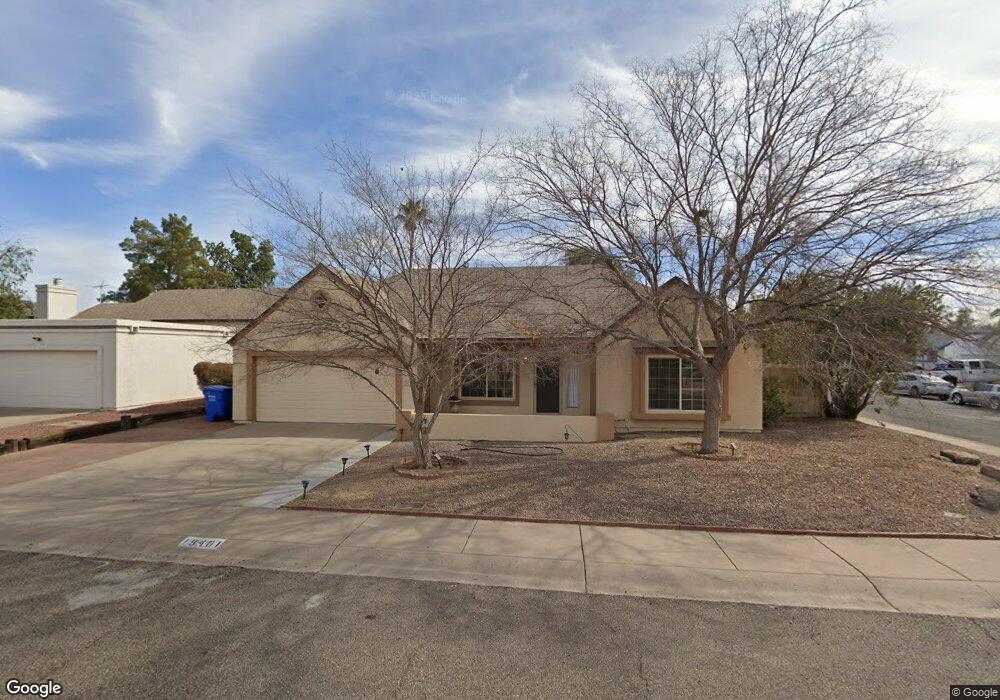
19401 N 9th Place Phoenix, AZ 85024
North Central Phoenix NeighborhoodEstimated Value: $388,000 - $445,000
4
Beds
3
Baths
1,578
Sq Ft
$267/Sq Ft
Est. Value
About This Home
This home is located at 19401 N 9th Place, Phoenix, AZ 85024 and is currently estimated at $421,410, approximately $267 per square foot. 19401 N 9th Place is a home located in Maricopa County with nearby schools including Eagle Ridge Elementary School, Mountain Trail Middle School, and North Canyon High School.
Ownership History
Date
Name
Owned For
Owner Type
Purchase Details
Closed on
Jul 17, 2019
Sold by
Males David and Males Rhonda
Bought by
Males David and Males Rhonda
Current Estimated Value
Purchase Details
Closed on
Jul 12, 2011
Sold by
Hsbc Mortgage Services Inc
Bought by
Males David and Males Rhonda
Purchase Details
Closed on
Feb 10, 2011
Sold by
Garcia Teodosa M and Garcia Mark A
Bought by
Hsbc Mortgage Services Inc
Purchase Details
Closed on
Nov 29, 2006
Sold by
Young Philip M
Bought by
Garcia Mark A and Garcia Teodosa M
Home Financials for this Owner
Home Financials are based on the most recent Mortgage that was taken out on this home.
Original Mortgage
$285,000
Interest Rate
7.65%
Mortgage Type
Purchase Money Mortgage
Purchase Details
Closed on
Aug 19, 2005
Sold by
Young Joann
Bought by
Young Phillip M
Home Financials for this Owner
Home Financials are based on the most recent Mortgage that was taken out on this home.
Original Mortgage
$180,700
Interest Rate
6.5%
Mortgage Type
Fannie Mae Freddie Mac
Create a Home Valuation Report for This Property
The Home Valuation Report is an in-depth analysis detailing your home's value as well as a comparison with similar homes in the area
Home Values in the Area
Average Home Value in this Area
Purchase History
| Date | Buyer | Sale Price | Title Company |
|---|---|---|---|
| Males David | -- | None Available | |
| Males David | $96,500 | Security Title Agency | |
| Hsbc Mortgage Services Inc | $105,907 | None Available | |
| Garcia Mark A | $285,000 | Equity Title Agency Inc | |
| Young Phillip M | -- | Security Title Agency Inc | |
| Young Philip M | $285,000 | Security Title Agency Inc |
Source: Public Records
Mortgage History
| Date | Status | Borrower | Loan Amount |
|---|---|---|---|
| Previous Owner | Garcia Mark A | $285,000 | |
| Previous Owner | Young Philip M | $180,700 |
Source: Public Records
Tax History
| Year | Tax Paid | Tax Assessment Tax Assessment Total Assessment is a certain percentage of the fair market value that is determined by local assessors to be the total taxable value of land and additions on the property. | Land | Improvement |
|---|---|---|---|---|
| 2025 | $1,298 | $14,995 | -- | -- |
| 2024 | $1,236 | $14,281 | -- | -- |
| 2023 | $1,236 | $31,260 | $6,250 | $25,010 |
| 2022 | $1,225 | $24,380 | $4,870 | $19,510 |
| 2021 | $1,245 | $22,400 | $4,480 | $17,920 |
| 2020 | $1,202 | $21,230 | $4,240 | $16,990 |
| 2019 | $1,208 | $19,620 | $3,920 | $15,700 |
| 2018 | $1,164 | $18,070 | $3,610 | $14,460 |
| 2017 | $1,111 | $15,770 | $3,150 | $12,620 |
| 2016 | $1,094 | $14,030 | $2,800 | $11,230 |
| 2015 | $1,015 | $13,730 | $2,740 | $10,990 |
Source: Public Records
Map
Nearby Homes
- 19407 N 9th St
- 19613 N 9th St
- 1002 E Oraibi Dr
- 19401 N 7st Lot 94 St Unit 94
- 19648 N 9th St
- 19401 N 7th St Unit 142
- 19401 N 7th St Unit 60
- 19401 N 7th St Unit 187
- 19401 N 7th St Unit 121
- 19401 N 7th St Unit 259
- 19401 N 7th St Unit 226
- 19401 N 7th St Unit 73
- 19401 N 7th St Unit 239
- 19601 N 7th St Unit 1056
- 19601 N 7th St Unit 2026
- 19601 N 7th St Unit 2107
- 19601 N 7th St Unit 1005
- 1314 E Utopia Rd
- 19234 N 6th St
- 19801 N 6th Place
- 19407 N 9th Place
- 19402 N 10th St
- 19408 N 10th St
- 19415 N 9th Place
- 931 E Utopia Rd
- 923 E Utopia Rd
- 19402 N 9th Place
- 19416 N 10th St
- 19408 N 9th Place
- 937 E Utopia Rd
- 917 E Utopia Rd
- 19423 N 9th Place
- 19424 N 10th St
- 19416 N 9th Place
- 19424 N 9th Place
- 930 E Kristal Way
- 909 E Utopia Rd
- 19401 N 10th St
- 924 E Kristal Way
- 19407 N 10th St
Your Personal Tour Guide
Ask me questions while you tour the home.