Estimated Value: $470,000 - $523,000
3
Beds
2
Baths
1,542
Sq Ft
$317/Sq Ft
Est. Value
About This Home
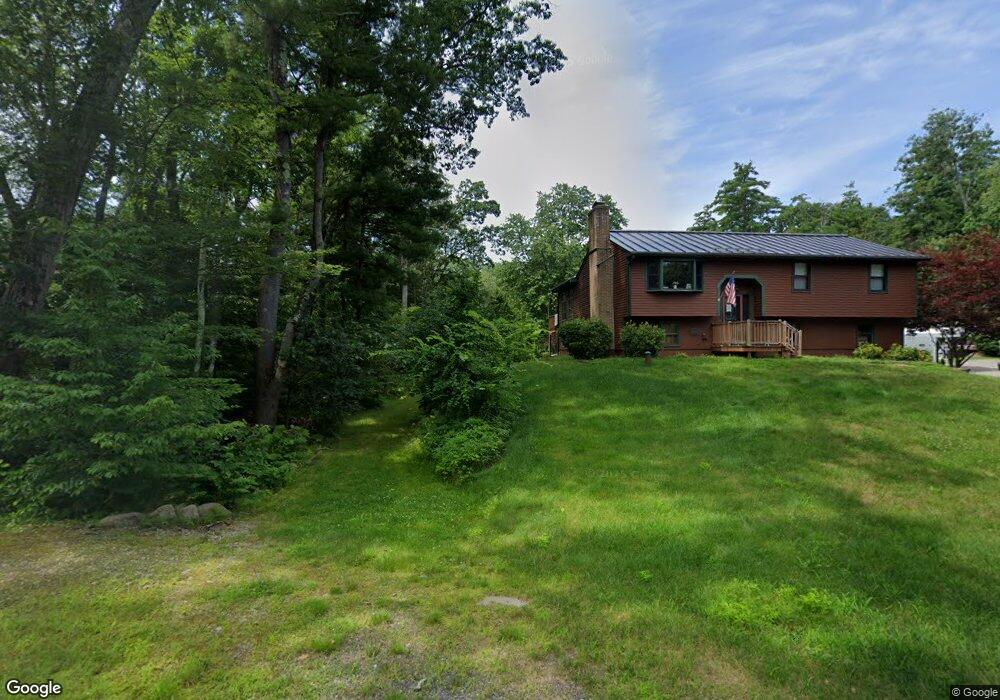
This home is located at 195 Bypass 28, Derry, NH 03038 and is currently estimated at $488,864, approximately $317 per square foot. 195 Bypass 28 is a home located in Rockingham County with nearby schools including Ernest P. Barka Elementary School, Gilbert H. Hood Middle School, and Pinkerton Academy.
Ownership History
Date
Name
Owned For
Owner Type
Purchase Details
Closed on
Dec 22, 2023
Sold by
Ferland Philip G
Bought by
Faino Dean and Bonneau Brandi
Current Estimated Value
Home Financials for this Owner
Home Financials are based on the most recent Mortgage that was taken out on this home.
Original Mortgage
$228,000
Outstanding Balance
$223,829
Interest Rate
7.5%
Mortgage Type
Purchase Money Mortgage
Estimated Equity
$265,035
Create a Home Valuation Report for This Property
The Home Valuation Report is an in-depth analysis detailing your home's value as well as a comparison with similar homes in the area
Home Values in the Area
Average Home Value in this Area
Purchase History
| Date | Buyer | Sale Price | Title Company |
|---|---|---|---|
| Faino Dean | $285,000 | None Available | |
| Faino Dean | $285,000 | None Available |
Source: Public Records
Mortgage History
| Date | Status | Borrower | Loan Amount |
|---|---|---|---|
| Open | Faino Dean | $228,000 | |
| Closed | Faino Dean | $228,000 |
Source: Public Records
Tax History Compared to Growth
Tax History
| Year | Tax Paid | Tax Assessment Tax Assessment Total Assessment is a certain percentage of the fair market value that is determined by local assessors to be the total taxable value of land and additions on the property. | Land | Improvement |
|---|---|---|---|---|
| 2024 | $7,968 | $426,300 | $214,900 | $211,400 |
| 2023 | $7,616 | $368,300 | $182,700 | $185,600 |
| 2022 | $7,012 | $368,300 | $182,700 | $185,600 |
| 2021 | $7,012 | $283,200 | $140,600 | $142,600 |
| 2020 | $7,596 | $283,200 | $140,600 | $142,600 |
| 2019 | $32,226 | $238,900 | $109,500 | $129,400 |
| 2018 | $3,699 | $238,900 | $109,500 | $129,400 |
| 2017 | $32,979 | $209,300 | $99,500 | $109,800 |
| 2016 | $32,811 | $209,300 | $99,500 | $109,800 |
| 2015 | $5,443 | $186,200 | $99,500 | $86,700 |
| 2014 | $5,478 | $186,200 | $99,500 | $86,700 |
| 2013 | $5,429 | $172,400 | $91,500 | $80,900 |
Source: Public Records
Map
Nearby Homes