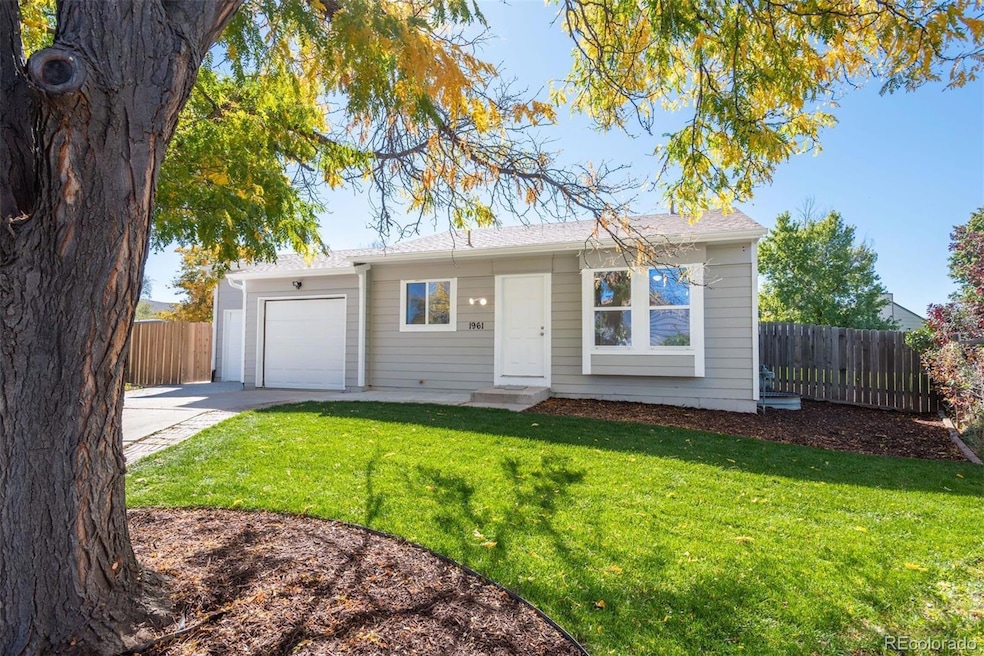
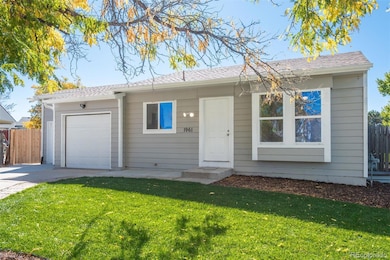
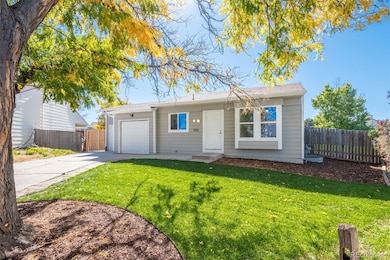
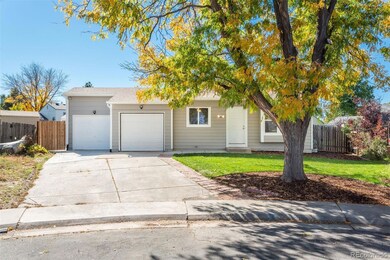
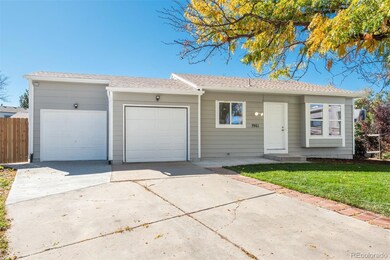
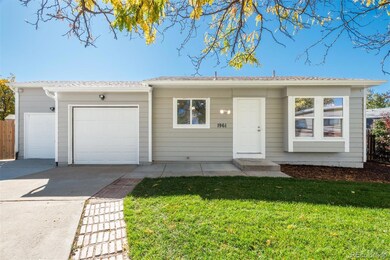
1961 Danube Way Aurora, CO 80011
Tower Triangle NeighborhoodEstimated payment $2,569/month
Highlights
- Primary Bedroom Suite
- Wood Flooring
- Private Yard
- Secluded Lot
- Bonus Room
- 4-minute walk to Sandy Creek Children's Park
About This Home
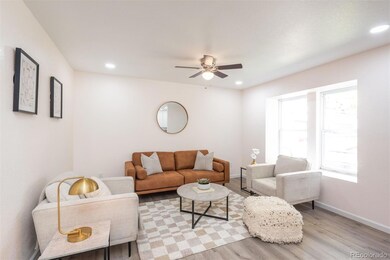
Move-In Ready & Fully Remodeled! This lovely 4 bedroom, 2 bathroom home in the Aurora Cascade neighborhood has been beautifully renovated from top to bottom. Fresh new paint inside and out, remodeled floors, walls, and doors, plus brand-new sod in the front and back yards with fresh landscaping. The exterior upgrades include a new roof, new paint and a rare 2-car garage. Inside, you’ll find luxury vinyl plank flooring throughout, new paint, new lighting, new carpet and freshly remodeled bathrooms. The kitchen shines with new quartz counters, modern sink and faucet, new white cabinets and new stainless steel appliances. Downstairs includes a flex room, perfect for cozy movie nights or a kids playroom. 2 additional bedrooms with egress windows, a large laundry room with plenty of storage and a brand new bathroom finishes off the interior. This home is turn-key, stylish, and ready for its new owner—schedule your showing today!
Listing Agent
LIV Sotheby's International Realty Brokerage Email: sonyakpeterson@gmail.com,303-587-7969 License #100031639 Listed on: 10/17/2025

Home Details
Home Type
- Single Family
Est. Annual Taxes
- $2,369
Year Built
- Built in 1982
Lot Details
- 5,244 Sq Ft Lot
- Cul-De-Sac
- Northeast Facing Home
- Dog Run
- Property is Fully Fenced
- Secluded Lot
- Private Yard
Parking
- 2 Car Attached Garage
Home Design
- Frame Construction
- Composition Roof
Interior Spaces
- 1-Story Property
- Ceiling Fan
- Bay Window
- Family Room
- Dining Room
- Bonus Room
- Fire and Smoke Detector
- Laundry Room
Kitchen
- Self-Cleaning Convection Oven
- Cooktop
- Dishwasher
- Disposal
Flooring
- Wood
- Laminate
- Vinyl
Bedrooms and Bathrooms
- 4 Bedrooms | 2 Main Level Bedrooms
- Primary Bedroom Suite
- 2 Full Bathrooms
Finished Basement
- Basement Fills Entire Space Under The House
- 2 Bedrooms in Basement
Outdoor Features
- Patio
- Rain Gutters
Schools
- Clyde Miller Elementary And Middle School
- Vista Peak High School
Utilities
- Forced Air Heating and Cooling System
- Natural Gas Connected
Community Details
- No Home Owners Association
- Aurora Cascades Subdivision
Listing and Financial Details
- Exclusions: Seller's personal property
- Assessor Parcel Number R0086700
Map
Home Values in the Area
Average Home Value in this Area
Tax History
| Year | Tax Paid | Tax Assessment Tax Assessment Total Assessment is a certain percentage of the fair market value that is determined by local assessors to be the total taxable value of land and additions on the property. | Land | Improvement |
|---|---|---|---|---|
| 2024 | $2,369 | $22,440 | $5,380 | $17,060 |
| 2023 | $2,406 | $26,310 | $5,070 | $21,240 |
| 2022 | $2,303 | $20,270 | $5,210 | $15,060 |
| 2021 | $2,399 | $20,270 | $5,210 | $15,060 |
| 2020 | $2,357 | $19,970 | $5,360 | $14,610 |
| 2019 | $2,352 | $19,970 | $5,360 | $14,610 |
| 2018 | $1,737 | $14,680 | $4,320 | $10,360 |
| 2017 | $1,543 | $14,680 | $4,320 | $10,360 |
| 2016 | $1,108 | $10,460 | $2,470 | $7,990 |
| 2015 | $1,074 | $10,460 | $2,470 | $7,990 |
| 2014 | -- | $8,700 | $1,990 | $6,710 |
Property History
| Date | Event | Price | List to Sale | Price per Sq Ft | Prior Sale |
|---|---|---|---|---|---|
| 11/12/2025 11/12/25 | Price Changed | $450,000 | -3.6% | $541 / Sq Ft | |
| 10/17/2025 10/17/25 | For Sale | $467,000 | +41.5% | $561 / Sq Ft | |
| 07/30/2025 07/30/25 | Sold | $330,000 | +1.5% | $198 / Sq Ft | View Prior Sale |
| 07/16/2025 07/16/25 | Pending | -- | -- | -- | |
| 07/12/2025 07/12/25 | For Sale | $325,000 | -- | $195 / Sq Ft |
Purchase History
| Date | Type | Sale Price | Title Company |
|---|---|---|---|
| Warranty Deed | $330,000 | Ct (Chicago Title) | |
| Warranty Deed | $130,000 | -- | |
| Warranty Deed | $75,500 | Land Title |
Mortgage History
| Date | Status | Loan Amount | Loan Type |
|---|---|---|---|
| Previous Owner | $132,600 | VA | |
| Previous Owner | $75,204 | FHA |
Source: REcolorado®
MLS Number: 2676876
APN: 1821-34-3-08-020
Disclaimer: Certain information contained herein is derived from information provided by parties other than Homes.com. All information provided is deemed reliable, but is not guaranteed to be accurate and should be independently verified.
![]() The content relating to real estate for sale in this Web site comes in part from the Internet Data eXchange (“IDX”) program of METROLIST, INC., DBA RECOLORADO®. Real estate listings held by brokers other than Ten-X are marked with the IDX Logo. This information is being provided for the consumers’ personal, non-commercial use and may not be used for any other purpose. All information subject to change and should be independently verified.
The content relating to real estate for sale in this Web site comes in part from the Internet Data eXchange (“IDX”) program of METROLIST, INC., DBA RECOLORADO®. Real estate listings held by brokers other than Ten-X are marked with the IDX Logo. This information is being provided for the consumers’ personal, non-commercial use and may not be used for any other purpose. All information subject to change and should be independently verified.
This publication is designed to provide information with regard to the subject matter covered. It is displayed with the understanding that the publisher and authors are not engaged in rendering real estate, legal, accounting, tax, or other professional services and that the publisher and authors are not offering such advice in this publication. If real estate, legal, or other expert assistance is required, the services of a competent, professional person should be sought.
The information contained in this publication is subject to change without notice. METROLIST, INC., DBA RECOLORADO MAKES NO WARRANTY OF ANY KIND WITH REGARD TO THIS MATERIAL, INCLUDING, BUT NOT LIMITED TO, THE IMPLIED WARRANTIES OF MERCHANTABILITY AND FITNESS FOR A PARTICULAR PURPOSE. METROLIST, INC., DBA RECOLORADO SHALL NOT BE LIABLE FOR ERRORS CONTAINED HEREIN OR FOR ANY DAMAGES IN CONNECTION WITH THE FURNISHING, PERFORMANCE, OR USE OF THIS MATERIAL.
PUBLISHER’S NOTICE: All real estate advertised herein is subject to the Federal Fair Housing Act and the Colorado Fair Housing Act, which Acts make it illegal to make or publish any advertisement that indicates any preference, limitation, or discrimination based on race, color, religion, sex, handicap, familial status, or national origin.
METROLIST, INC., DBA RECOLORADO will not knowingly accept any advertising for real estate that is in violation of the law. All persons are hereby informed that all dwellings advertised are available on an equal opportunity basis.
© 2025 METROLIST, INC., DBA RECOLORADO® – All Rights Reserved. 6455 S. Yosemite St., Suite 500 Greenwood Village, CO 80111 USA
ALL RIGHTS RESERVED WORLDWIDE. No part of this publication may be reproduced, adapted, translated, stored in a retrieval system or transmitted in any form or by any means, electronic, mechanical, photocopying, recording, or otherwise, without the prior written permission of the publisher. The information contained herein including but not limited to all text, photographs, digital images, virtual tours, may be seeded and monitored for protection and tracking.
- 1958 Cathay Ct
- 1956 Cathay St
- 2039 Espana Way
- 1791 Biscay St
- 19335 E Batavia Place
- 1914 Ensenada Ct
- 19056 E 16th Place
- 1619 Ensenada St
- 19524 Montview Dr
- 19054 E 16th Ave
- 19044 E 16th Ave
- 1662 Biscay Cir
- 19542 E 19th Place
- 18944 E Carmel Dr
- 19537 E 18th Ave
- 19139 E 22nd Cir
- 1642 Andes St
- 19958 E Batavia Dr
- 20364 E Buchanan Dr
- 20601 E Buchanan Dr
- 19038 E Carmel Dr
- 16651 E 16th Place
- 16749 E 13th Ave
- 1711 Norfolk St Unit D
- 3841 N Himalaya Rd
- 3841 N Himalaya Rd Unit 4
- 1455 Norfolk St
- 16486 E 14th Place
- 16484 E 14th Place Unit Milner Properties
- 16300 E 17th Place
- 19502 E 41st Ave
- 1363 Mobile St Unit 1363
- 4148 Genoa St
- 20296 E 41st Place
- 3910 Salida St
- 3944 Malta St
- 19410 E 45th Ave
- 15899 E 13th Place
- 19401 E 45th Ave
- 21092 E 40th Place