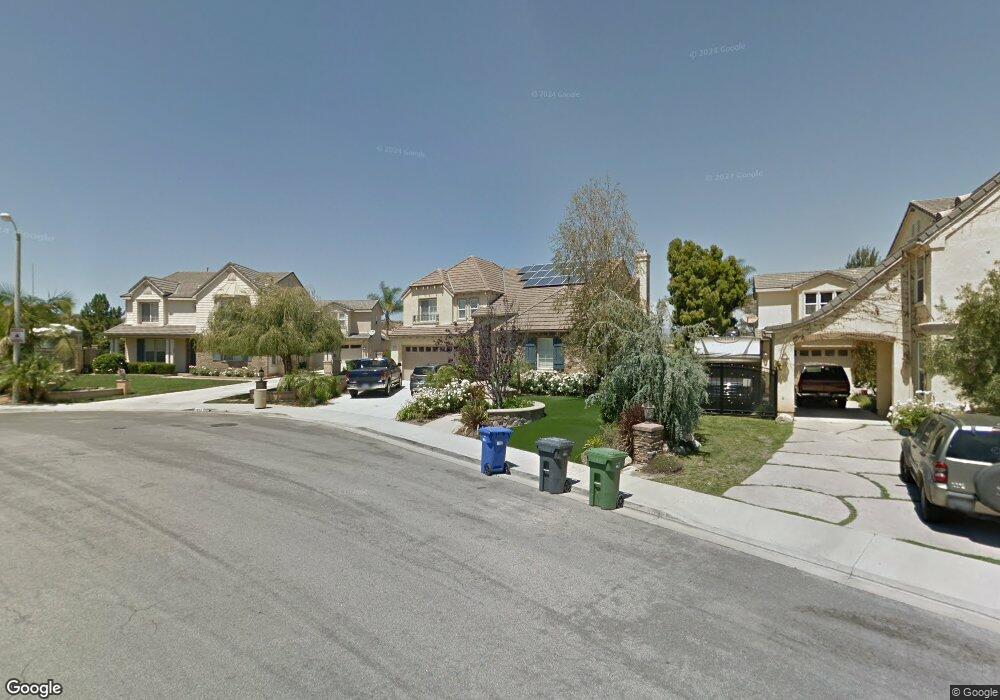
1975 Rheinland Ct Simi Valley, CA 93065
West Simi Valley NeighborhoodEstimated Value: $1,265,005 - $1,512,000
4
Beds
3
Baths
2,888
Sq Ft
$479/Sq Ft
Est. Value
About This Home
This home is located at 1975 Rheinland Ct, Simi Valley, CA 93065 and is currently estimated at $1,383,751, approximately $479 per square foot. 1975 Rheinland Ct is a home located in Ventura County with nearby schools including Crestview Elementary School, Hillside Middle School, and Royal High School.
Ownership History
Date
Name
Owned For
Owner Type
Purchase Details
Closed on
Apr 27, 2011
Sold by
Conejo Capital Partners Llc
Bought by
Bernhardt Mark and Moore Debra
Current Estimated Value
Home Financials for this Owner
Home Financials are based on the most recent Mortgage that was taken out on this home.
Original Mortgage
$536,000
Outstanding Balance
$369,911
Interest Rate
4.73%
Mortgage Type
New Conventional
Estimated Equity
$1,013,840
Purchase Details
Closed on
Aug 30, 2010
Sold by
Rose Lawrence J and Rose Rizalina D
Bought by
Conejo Capital Partners Llc
Purchase Details
Closed on
May 14, 2002
Sold by
South Hills 107
Bought by
Rose Lawrence J and Rose Rizalina D
Home Financials for this Owner
Home Financials are based on the most recent Mortgage that was taken out on this home.
Original Mortgage
$436,830
Interest Rate
6.94%
Create a Home Valuation Report for This Property
The Home Valuation Report is an in-depth analysis detailing your home's value as well as a comparison with similar homes in the area
Home Values in the Area
Average Home Value in this Area
Purchase History
| Date | Buyer | Sale Price | Title Company |
|---|---|---|---|
| Bernhardt Mark | $670,000 | Consumers Title Company | |
| Conejo Capital Partners Llc | -- | None Available | |
| Rose Lawrence J | $546,500 | First American Title Ins Co |
Source: Public Records
Mortgage History
| Date | Status | Borrower | Loan Amount |
|---|---|---|---|
| Open | Bernhardt Mark | $536,000 | |
| Previous Owner | Rose Lawrence J | $436,830 | |
| Closed | Rose Lawrence J | $109,200 |
Source: Public Records
Tax History Compared to Growth
Tax History
| Year | Tax Paid | Tax Assessment Tax Assessment Total Assessment is a certain percentage of the fair market value that is determined by local assessors to be the total taxable value of land and additions on the property. | Land | Improvement |
|---|---|---|---|---|
| 2025 | $9,996 | $858,377 | $429,189 | $429,188 |
| 2024 | $9,996 | $841,547 | $420,774 | $420,773 |
| 2023 | $9,403 | $825,047 | $412,524 | $412,523 |
| 2022 | $9,397 | $808,870 | $404,435 | $404,435 |
| 2021 | $9,356 | $793,010 | $396,505 | $396,505 |
| 2020 | $9,182 | $784,882 | $392,441 | $392,441 |
| 2019 | $8,769 | $769,494 | $384,747 | $384,747 |
| 2018 | $8,715 | $754,406 | $377,203 | $377,203 |
| 2017 | $8,535 | $739,614 | $369,807 | $369,807 |
| 2016 | $8,159 | $725,112 | $362,556 | $362,556 |
| 2015 | $8,003 | $714,222 | $357,111 | $357,111 |
| 2014 | $7,908 | $700,232 | $350,116 | $350,116 |
Source: Public Records
Map
Nearby Homes
- 1937 Arielle Ln
- 887 Erringer Rd
- 1917 Fitzgerald Rd
- 1847 Fitzgerald Rd
- 833 Crosby Ave
- 2221 Fitzgerald Rd
- 1077 Haven Ave
- 896 Moffatt Cir
- 2277 Stinson St
- 1891 Moore St
- 1034 Mead Ave
- 2049 Stanford Dr
- 2425 Dusan St
- 2056 Casual Ct
- 1936 Arcane St
- 1506 Rambling Rd
- 1855 Arcane St
- 961 Hudspeth St
- 175 Wrangler Rd
- 1959 Rheinland Ct
- 1958 Rheinland Ct
- 1997 Arielle Ln
- 1974 Rheinland Ct
- 2007 Erin Ct
- 590 Peter Place
- 1990 Rheinland Ct
- 2009 Arielle Ln
- 557 Peter Place
- 591 Astorian Dr
- 536 Astorian Dr
- 2019 Erin Ct
- 2024 Arielle Ln
- 659 Asia Ct
- 535 Peter Place
- 548 Peter Place
- 675 Asia Ct
- 567 Astorian Dr
- 2031 Erin Ct
- 2024 Erin Ct