Estimated Value: $369,000 - $504,862
4
Beds
2
Baths
1,603
Sq Ft
$291/Sq Ft
Est. Value
About This Home
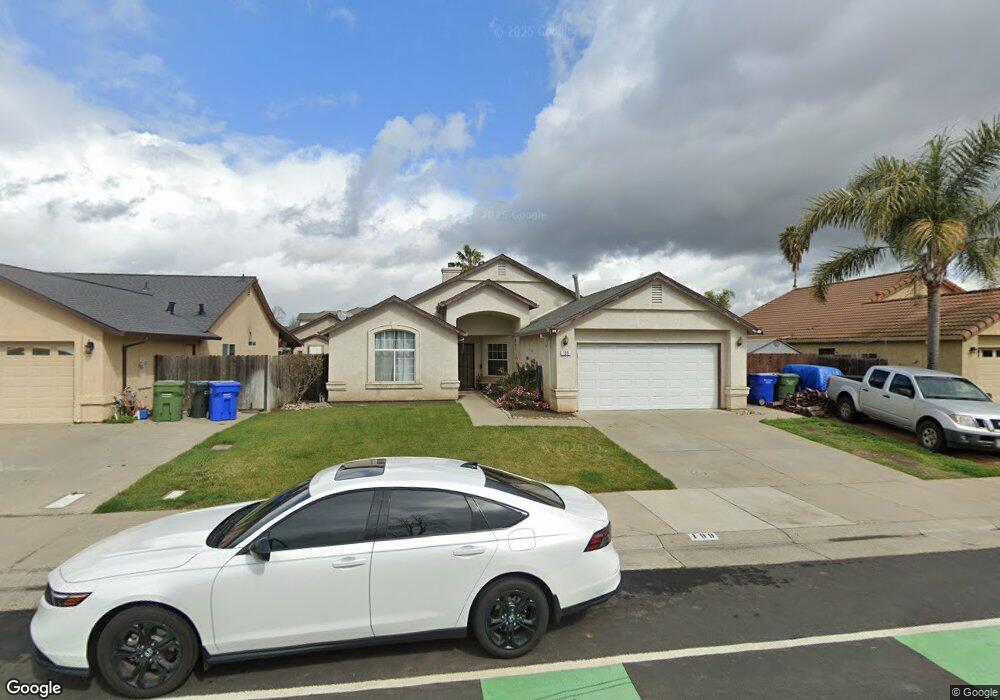
This home is located at 199 W C St, Galt, CA 95632 and is currently estimated at $466,966, approximately $291 per square foot. 199 W C St is a home located in Sacramento County with nearby schools including Vernon E. Greer Elementary School, Robert L. McCaffrey Middle School, and Galt High School.
Ownership History
Date
Name
Owned For
Owner Type
Purchase Details
Closed on
Oct 26, 2020
Sold by
Reid Keith and Reid Amber
Bought by
Reid Keith and Reid Amber
Current Estimated Value
Home Financials for this Owner
Home Financials are based on the most recent Mortgage that was taken out on this home.
Original Mortgage
$195,500
Outstanding Balance
$141,211
Interest Rate
2.8%
Mortgage Type
New Conventional
Estimated Equity
$325,755
Purchase Details
Closed on
Mar 3, 2005
Sold by
Harrell Amber
Bought by
Reid Keith and Harrell Amber
Home Financials for this Owner
Home Financials are based on the most recent Mortgage that was taken out on this home.
Original Mortgage
$203,000
Interest Rate
5.65%
Mortgage Type
New Conventional
Purchase Details
Closed on
Oct 26, 1998
Sold by
Four Seasons General Contractors Inc
Bought by
Harrell Amber
Home Financials for this Owner
Home Financials are based on the most recent Mortgage that was taken out on this home.
Original Mortgage
$125,000
Interest Rate
6.6%
Create a Home Valuation Report for This Property
The Home Valuation Report is an in-depth analysis detailing your home's value as well as a comparison with similar homes in the area
Home Values in the Area
Average Home Value in this Area
Purchase History
| Date | Buyer | Sale Price | Title Company |
|---|---|---|---|
| Reid Keith | -- | North American Title | |
| Reid Keith | -- | Chicago Title Co | |
| Harrell Amber | $120,000 | Sacramento Title Company |
Source: Public Records
Mortgage History
| Date | Status | Borrower | Loan Amount |
|---|---|---|---|
| Open | Reid Keith | $195,500 | |
| Closed | Reid Keith | $203,000 | |
| Closed | Harrell Amber | $125,000 | |
| Closed | Harrell Amber | $14,000 |
Source: Public Records
Tax History
| Year | Tax Paid | Tax Assessment Tax Assessment Total Assessment is a certain percentage of the fair market value that is determined by local assessors to be the total taxable value of land and additions on the property. | Land | Improvement |
|---|---|---|---|---|
| 2025 | $2,976 | $258,210 | $28,205 | $230,005 |
| 2024 | $2,976 | $253,148 | $27,652 | $225,496 |
| 2023 | $2,928 | $248,185 | $27,110 | $221,075 |
| 2022 | $4,075 | $243,320 | $26,579 | $216,741 |
| 2021 | $2,399 | $201,295 | $26,058 | $175,237 |
| 2020 | $2,380 | $199,232 | $25,791 | $173,441 |
| 2019 | $2,325 | $195,327 | $25,286 | $170,041 |
| 2018 | $2,320 | $191,498 | $24,791 | $166,707 |
| 2017 | $2,236 | $187,744 | $24,305 | $163,439 |
| 2016 | $2,155 | $184,064 | $23,829 | $160,235 |
| 2015 | $2,087 | $181,301 | $23,472 | $157,829 |
| 2014 | $2,081 | $177,751 | $23,013 | $154,738 |
Source: Public Records
Map
Nearby Homes
- 214 Cinnamon Dr
- 0 B St Unit 226013319
- 105 Kent St
- 14076 Saradale Ln
- 240 3rd St
- 323 Emerald Oak Dr
- 229 Sandpiper Dr
- 700 2nd St Unit 40
- 700 2nd St Unit 14
- 83 Sunshine Dr
- 150 Spruce Ave
- 402 Alpen Rose Way
- 667 Germaine Dr
- 14130 Sargent Ave
- 232 Oak Ave
- 515 E St
- 246 Oak Ave
- 712 Church St
- 219 Lois Ave
- 0 Kost Rd Unit 226013161
Your Personal Tour Guide
Ask me questions while you tour the home.