19931 Claremont Rd Madera, CA 93638
Estimated Value: $320,000 - $444,140
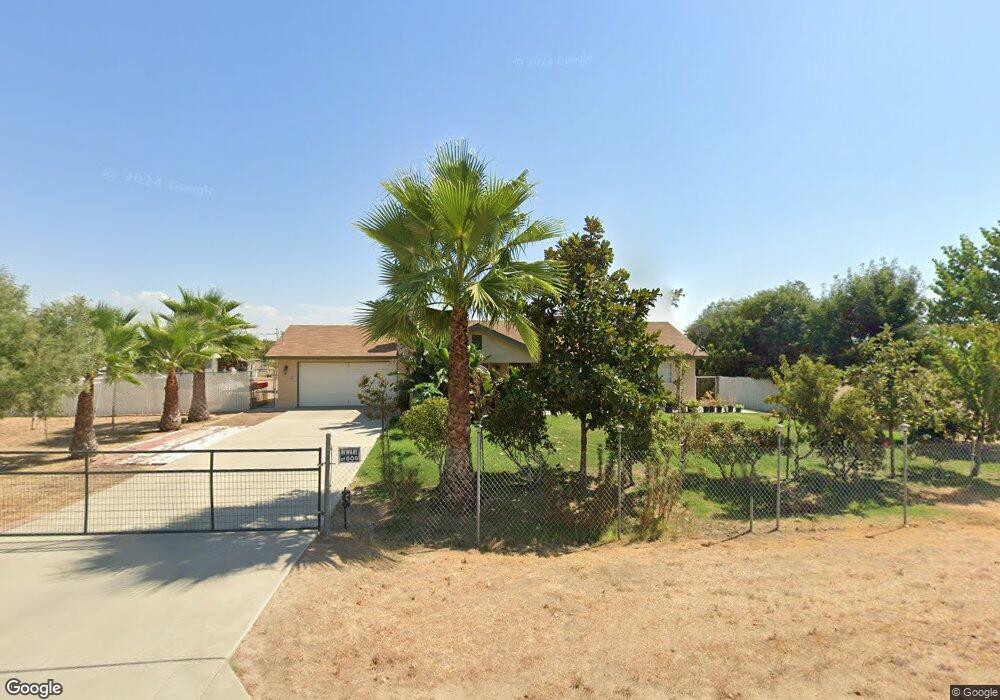
About This Home
This home is located at 19931 Claremont Rd, Madera, CA 93638 and is currently estimated at $410,285, approximately $338 per square foot. 19931 Claremont Rd is a home located in Madera County with nearby schools including John J. Pershing Elementary School, Jack G. Desmond Middle School, and Madera South High School.
Ownership History
We collect this data history from publicly available records. To have your information removed, we recommend requesting removal directly through your county’s website.
Purchase Details
Home Financials for this Owner
Home Financials are based on the most recent Mortgage that was taken out on this home.Purchase Details
Home Financials for this Owner
Home Financials are based on the most recent Mortgage that was taken out on this home.Purchase Details
Home Financials for this Owner
Home Financials are based on the most recent Mortgage that was taken out on this home.Purchase History
We collect this data history from publicly available records. To have your information removed, we recommend requesting removal directly through your county’s website.
| Date | Buyer | Sale Price | Title Company |
|---|---|---|---|
| $155,000 | First American Title | ||
| $111,500 | Chicago Title Co | ||
| $20,000 | Chicago Title Co |
Mortgage History
We collect this data history from publicly available records. To have your information removed, we recommend requesting removal directly through your county’s website.
| Date | Status | Borrower | Loan Amount |
|---|---|---|---|
| Open | $139,255 | ||
| Previous Owner | $113,227 | ||
| Previous Owner | $75,000 |
Tax History
We collect this data history from publicly available records. To have your information removed, we recommend requesting removal directly through your county’s website.
| Year | Tax Paid | Tax Assessment Tax Assessment Total Assessment is a certain percentage of the fair market value that is determined by local assessors to be the total taxable value of land and additions on the property. | Land | Improvement |
|---|---|---|---|---|
| 2025 | $2,456 | $220,212 | $58,140 | $162,072 |
| 2023 | $2,456 | $211,663 | $55,883 | $155,780 |
| 2022 | $2,291 | $207,514 | $54,788 | $152,726 |
| 2021 | $2,246 | $203,446 | $53,714 | $149,732 |
| 2020 | $2,287 | $201,361 | $53,164 | $148,197 |
| 2019 | $2,134 | $186,135 | $45,725 | $140,410 |
| 2018 | $1,945 | $180,713 | $44,393 | $136,320 |
| 2017 | $1,726 | $159,923 | $39,286 | $120,637 |
| 2016 | $1,604 | $149,930 | $36,624 | $113,306 |
| 2015 | $1,542 | $142,790 | $34,880 | $107,910 |
| 2014 | $1,342 | $131,000 | $32,000 | $99,000 |
Map
- 19609 Claremont Rd
- 19650 Road 31
- 19729 Brightwood Rd
- 19774 Road 31
- 31341 Brightwood
- 20349 Brightwood Rd
- 19730 Olympia Rd
- 20689 Olympia Rd
- 20770 Road 30 Unit 1-2
- 0 Road 30 Unit MC26058749
- 21035 Forest Glen Rd
- 21250 Del Monte Rd
- 17703 El Camino Rd
- N Side of Ave 19 1 2 Unit E of Rd 28 1/2
- 1 Rd 28 1 2
- 0 El Camino Rd
- 80 Avenue 21 1 2
- 22250 Stabulis Ct
- 28702 Rancho Ave
- 28565 Avenue 21
- 19971 Claremont Rd
- 19930 Claremont Rd
- 19972 Claremont Rd
- 19892 Claremont Rd
- 19853 Claremont Rd
- 19854 Claremont Rd
- 19814 Claremont Rd
- 19813 Claremont Rd
- 19931 Road 31
- 19775 Claremont Rd
- 19971 Road 31
- 19853 Road 31
- 20029 Road 31
- 19774 Claremont Rd
- 19813 Road 31
- 19775 Road 31
- 19729 Claremont Rd
- 19730 Claremont Rd
- 19892 Road 31
- 20065 Road 31
Ask me questions while you tour the home.