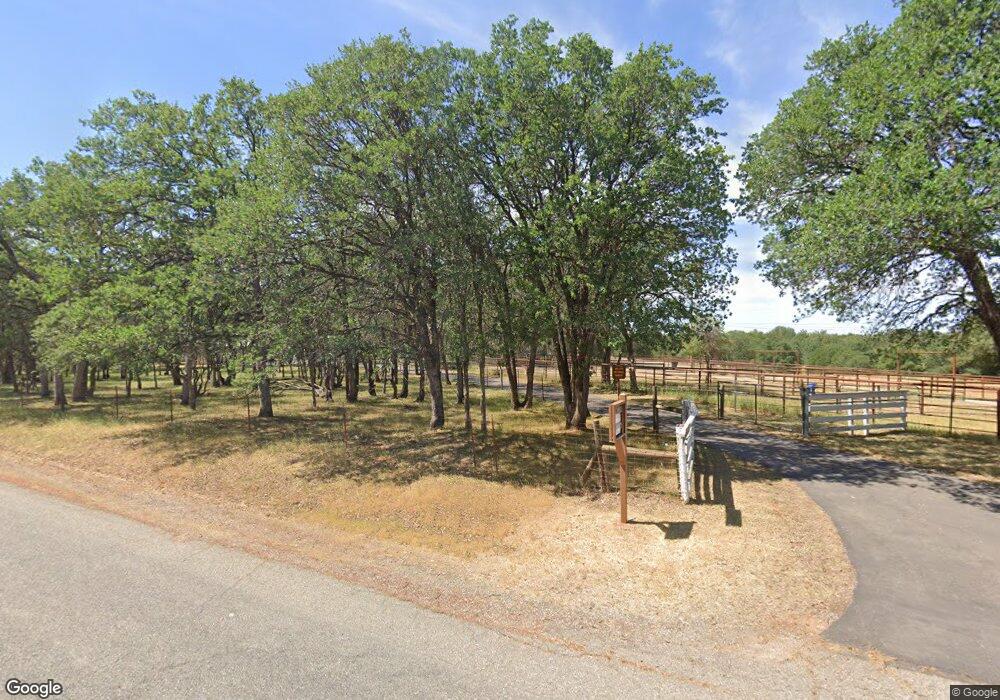
19970 Quercus Lobata Byway Red Bluff, CA 96080
Estimated Value: $134,000 - $522,000
3
Beds
2
Baths
1,560
Sq Ft
$234/Sq Ft
Est. Value
About This Home
This home is located at 19970 Quercus Lobata Byway, Red Bluff, CA 96080 and is currently estimated at $365,820, approximately $234 per square foot. 19970 Quercus Lobata Byway is a home located in Tehama County with nearby schools including Jackson Heights Elementary School, Vista Preparatory Academy, and Red Bluff High School.
Ownership History
Date
Name
Owned For
Owner Type
Purchase Details
Closed on
Mar 17, 2020
Sold by
Miller Jacob A
Bought by
Miller Jacob A and Miller Rosabelle D
Current Estimated Value
Home Financials for this Owner
Home Financials are based on the most recent Mortgage that was taken out on this home.
Original Mortgage
$165,750
Outstanding Balance
$130,739
Interest Rate
3.4%
Mortgage Type
New Conventional
Estimated Equity
$235,081
Purchase Details
Closed on
Mar 28, 2019
Sold by
U S Bank National Association
Bought by
Miller Jacob A
Purchase Details
Closed on
Aug 29, 2018
Sold by
Quality Loan Service Corporation
Bought by
Us Bank National Association
Purchase Details
Closed on
Sep 17, 2007
Sold by
Ryberg Frank C and Ryberg Jean M
Bought by
Ryberg Frank C and Ryberg Jean M
Home Financials for this Owner
Home Financials are based on the most recent Mortgage that was taken out on this home.
Original Mortgage
$334,875
Interest Rate
5.15%
Mortgage Type
Reverse Mortgage Home Equity Conversion Mortgage
Create a Home Valuation Report for This Property
The Home Valuation Report is an in-depth analysis detailing your home's value as well as a comparison with similar homes in the area
Home Values in the Area
Average Home Value in this Area
Purchase History
| Date | Buyer | Sale Price | Title Company |
|---|---|---|---|
| Miller Jacob A | -- | First American Title Company | |
| Miller Jacob A | $96,000 | Northern California Title Co | |
| Us Bank National Association | $195,516 | Accommodation | |
| Ryberg Frank C | -- | Placer Title Company | |
| Ryberg Frank C | -- | Placer Title Company |
Source: Public Records
Mortgage History
| Date | Status | Borrower | Loan Amount |
|---|---|---|---|
| Open | Miller Jacob A | $165,750 | |
| Previous Owner | Ryberg Frank C | $334,875 |
Source: Public Records
Tax History Compared to Growth
Tax History
| Year | Tax Paid | Tax Assessment Tax Assessment Total Assessment is a certain percentage of the fair market value that is determined by local assessors to be the total taxable value of land and additions on the property. | Land | Improvement |
|---|---|---|---|---|
| 2025 | $2,168 | $217,993 | $111,550 | $106,443 |
| 2023 | $2,132 | $209,529 | $107,219 | $102,310 |
| 2022 | $2,115 | $205,421 | $105,117 | $100,304 |
| 2021 | $2,026 | $201,394 | $103,056 | $98,338 |
| 2020 | $2,067 | $199,330 | $102,000 | $97,330 |
| 2019 | $1,655 | $150,000 | $125,000 | $25,000 |
| 2018 | $691 | $65,222 | $46,365 | $18,857 |
| 2017 | $696 | $63,944 | $45,456 | $18,488 |
| 2016 | $651 | $62,691 | $44,565 | $18,126 |
| 2015 | -- | $61,750 | $43,896 | $17,854 |
| 2014 | $631 | $60,542 | $43,037 | $17,505 |
Source: Public Records
Map
Nearby Homes
- 19911 State Highway 36 W
- 14575 Kinney Ave
- 15410 Autumn Oaks Ct
- 14480 Warren Ave
- 0 Vintage Dr Unit 23007603
- 14721 Nevis Rd
- 14485 Ryan Ln
- 00 Juaquin Ln
- 20662 Saddlebrook Dr
- 000 Old Mission Dr
- 13905 Mendenhall Rd
- 15775 Skyline Dr
- 0 Penneleme Rd
- 18771 Drake Rd
- 14860 Oak Knoll Dr
- 19600 Sunshine Dr
- 14610 Hanks Dr
- 16240 Old Mission Dr
- 21247 Creekside Dr
- 18574 Stallion Dr
- 20010 Quercus Lobata Byway
- 20015 Quercus Lobata Byway
- 20020 Quercus Lobata Byway
- 20005 Quercus Lobata Byway
- 19955 Quercus Lobata Byway
- 19965 Quercus Lobata Byway
- 20030 Quercus Lobata Byway
- 19900 Quercus Lobata Byway
- 14985 Roglynn Rd
- 15059 Mccoy Rd
- 20075 Quercus Lobata Byway
- 14945 Caylor Ln
- 0 Mccoy Rd Unit 201040774
- 0 Mccoy Rd Unit 12011096
- 0 Mccoy Rd Unit 12081061
- 0 Mccoy Rd Unit 20230836
- 0 Mccoy Rd Unit 223014132
- 0 Mccoy Rd Unit 20220373
- 19887 Quercus Lobata Byway
- 19885 Quercus Lobata Byway