Estimated Value: $283,000 - $305,915
3
Beds
1
Bath
900
Sq Ft
$325/Sq Ft
Est. Value
About This Home
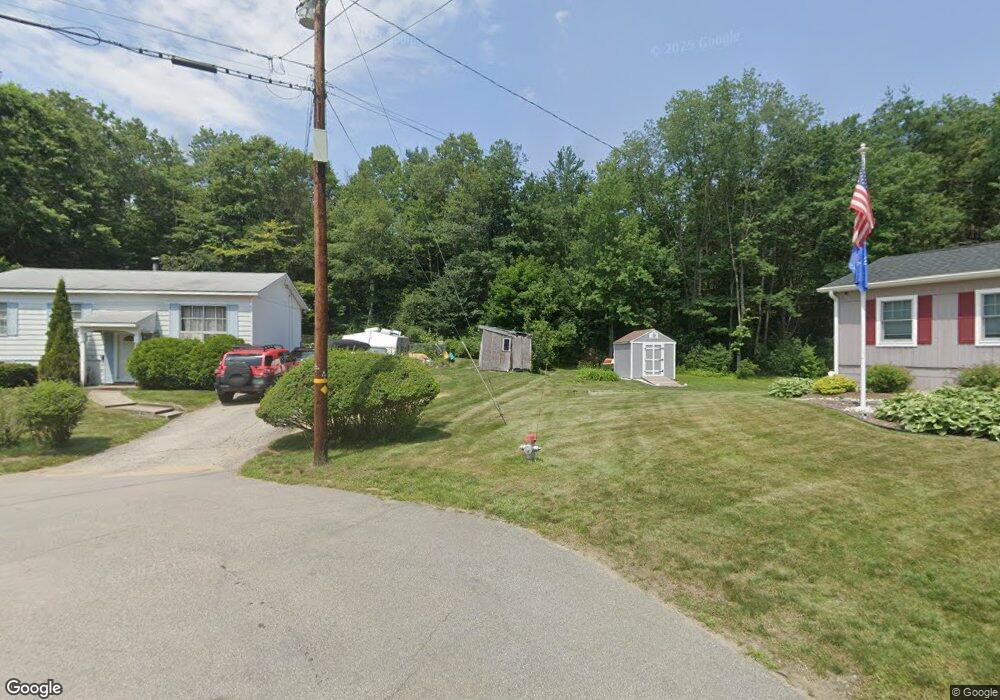
This home is located at 20 Clark Cir, Keene, NH 03431 and is currently estimated at $292,729, approximately $325 per square foot. 20 Clark Cir is a home with nearby schools including Greenlee Primary School, Keene Middle School, and Mayland Early College High School.
Ownership History
Date
Name
Owned For
Owner Type
Purchase Details
Closed on
Jul 25, 2000
Sold by
Johnson Arthur L and Johnson Donna M
Bought by
Pendilla Darrell A and Pendilla Shannon T
Current Estimated Value
Home Financials for this Owner
Home Financials are based on the most recent Mortgage that was taken out on this home.
Original Mortgage
$87,027
Interest Rate
8.28%
Purchase Details
Closed on
Jun 11, 1996
Sold by
Cram Christopher V and Cram Karen M
Bought by
Shepard Brian M and Shepard Dorothy M
Home Financials for this Owner
Home Financials are based on the most recent Mortgage that was taken out on this home.
Original Mortgage
$79,650
Interest Rate
7.89%
Create a Home Valuation Report for This Property
The Home Valuation Report is an in-depth analysis detailing your home's value as well as a comparison with similar homes in the area
Home Values in the Area
Average Home Value in this Area
Purchase History
| Date | Buyer | Sale Price | Title Company |
|---|---|---|---|
| Pendilla Darrell A | $87,500 | -- | |
| Shepard Brian M | $79,900 | -- |
Source: Public Records
Mortgage History
| Date | Status | Borrower | Loan Amount |
|---|---|---|---|
| Open | Shepard Brian M | $152,026 | |
| Closed | Shepard Brian M | $87,027 | |
| Previous Owner | Shepard Brian M | $79,650 |
Source: Public Records
Tax History Compared to Growth
Tax History
| Year | Tax Paid | Tax Assessment Tax Assessment Total Assessment is a certain percentage of the fair market value that is determined by local assessors to be the total taxable value of land and additions on the property. | Land | Improvement |
|---|---|---|---|---|
| 2024 | $5,529 | $167,200 | $47,300 | $119,900 |
| 2023 | $5,233 | $164,100 | $47,300 | $116,800 |
| 2022 | $5,092 | $164,100 | $47,300 | $116,800 |
| 2021 | $5,133 | $164,100 | $47,300 | $116,800 |
| 2020 | $5,432 | $145,700 | $55,400 | $90,300 |
| 2019 | $5,478 | $145,700 | $55,400 | $90,300 |
| 2018 | $5,408 | $145,700 | $55,400 | $90,300 |
| 2017 | $5,427 | $145,800 | $55,500 | $90,300 |
| 2016 | $5,306 | $145,800 | $55,500 | $90,300 |
| 2015 | $5,564 | $161,700 | $62,700 | $99,000 |
Source: Public Records
Map
Nearby Homes
- 106 Pako Ave
- 11 Nut Hatch Ln
- 64 Old Walpole Rd
- 792 Court St Unit A
- 17 Blue Jay Ct
- 115 Liberty Ln
- 21 Glen Rd
- 184 Kennedy Dr
- 5 Surry Hill Dr
- 39 Windsor Ct Unit B
- 29 Windsor Ct Unit K
- 224 Darling Rd
- 32a Stonehouse Ln
- 89 Kendall Rd
- 28 Stonehouse Ln
- 0 Stevens St Unit 1
- 38 Stonehouse Ln Unit A
- 257 Park Ave
- 220 Hurricane Rd
- 7 Newman St