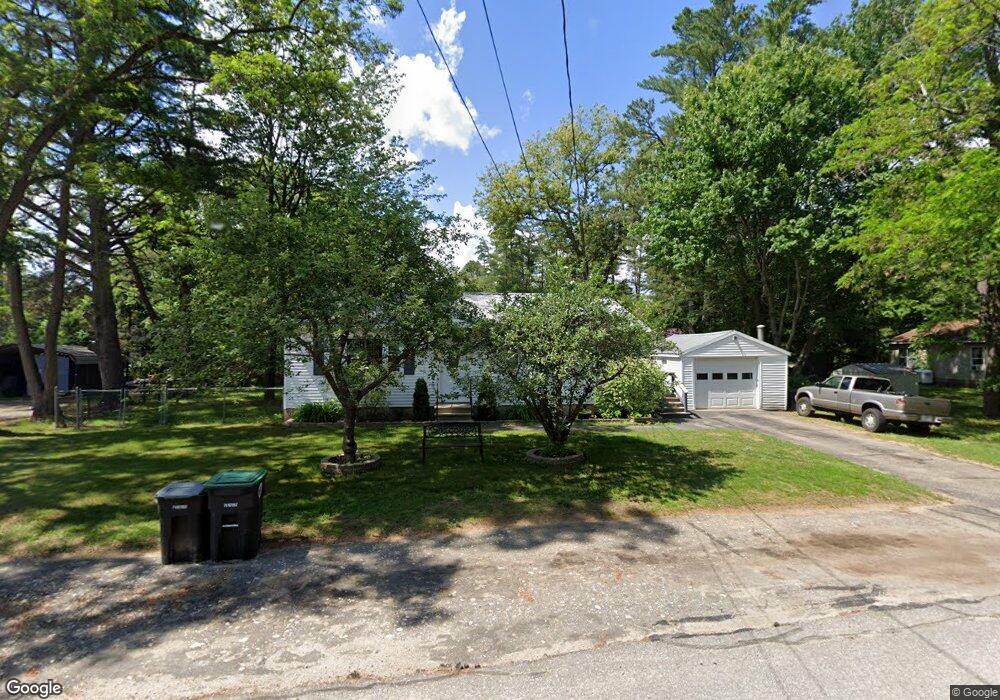
20 Hutchinson St Franklin, NH 03235
Estimated Value: $315,000 - $328,652
2
Beds
1
Bath
1,185
Sq Ft
$273/Sq Ft
Est. Value
About This Home
This home is located at 20 Hutchinson St, Franklin, NH 03235 and is currently estimated at $323,663, approximately $273 per square foot. 20 Hutchinson St is a home located in Merrimack County with nearby schools including Paul A. Smith School, Franklin Middle School, and Franklin High School.
Ownership History
Date
Name
Owned For
Owner Type
Purchase Details
Closed on
Nov 13, 2007
Sold by
Jp Morgan Mtg Acquisit
Bought by
Morang Albert C
Current Estimated Value
Home Financials for this Owner
Home Financials are based on the most recent Mortgage that was taken out on this home.
Original Mortgage
$129,950
Outstanding Balance
$82,602
Interest Rate
6.47%
Mortgage Type
Purchase Money Mortgage
Estimated Equity
$241,061
Purchase Details
Closed on
Sep 14, 2007
Sold by
Sharpe Barbara J
Bought by
Jp Morgan Chase Bk
Home Financials for this Owner
Home Financials are based on the most recent Mortgage that was taken out on this home.
Original Mortgage
$129,950
Outstanding Balance
$82,602
Interest Rate
6.47%
Mortgage Type
Purchase Money Mortgage
Estimated Equity
$241,061
Purchase Details
Closed on
Jul 6, 2005
Sold by
Andrus Mildred I
Bought by
Sharpe Barbara J
Home Financials for this Owner
Home Financials are based on the most recent Mortgage that was taken out on this home.
Original Mortgage
$130,000
Interest Rate
5.71%
Create a Home Valuation Report for This Property
The Home Valuation Report is an in-depth analysis detailing your home's value as well as a comparison with similar homes in the area
Home Values in the Area
Average Home Value in this Area
Purchase History
| Date | Buyer | Sale Price | Title Company |
|---|---|---|---|
| Morang Albert C | $135,000 | -- | |
| Jp Morgan Chase Bk | $134,300 | -- | |
| Sharpe Barbara J | $162,500 | -- | |
| Sharpe Barbara J | $162,500 | -- |
Source: Public Records
Mortgage History
| Date | Status | Borrower | Loan Amount |
|---|---|---|---|
| Open | Sharpe Barbara J | $129,950 | |
| Previous Owner | Sharpe Barbara J | $130,000 |
Source: Public Records
Tax History Compared to Growth
Tax History
| Year | Tax Paid | Tax Assessment Tax Assessment Total Assessment is a certain percentage of the fair market value that is determined by local assessors to be the total taxable value of land and additions on the property. | Land | Improvement |
|---|---|---|---|---|
| 2024 | $4,389 | $255,900 | $80,100 | $175,800 |
| 2023 | $4,161 | $255,900 | $80,100 | $175,800 |
| 2022 | $3,919 | $160,700 | $65,100 | $95,600 |
| 2021 | $3,730 | $160,700 | $65,100 | $95,600 |
| 2020 | $4,997 | $160,700 | $65,100 | $95,600 |
| 2019 | $3,611 | $160,700 | $65,100 | $95,600 |
| 2018 | $3,529 | $160,700 | $65,100 | $95,600 |
| 2017 | $2,914 | $114,000 | $27,800 | $86,200 |
| 2016 | $4,201 | $114,000 | $27,800 | $86,200 |
| 2015 | $1,991 | $79,800 | $19,460 | $60,340 |
| 2011 | $2,892 | $134,400 | $28,700 | $105,700 |
Source: Public Records
Map
Nearby Homes
- 11 Racine St
- 261 N Main St
- 150 Victory Dr
- 236 N Main St
- 0 Rowell Dr Unit 406 5043422
- 00 Finch and Kidder Ave
- 21 Mountain View Dr
- 4 Trail St
- 69 Lake Ave
- 182 Summit St
- 6 Morning Glory Dr
- 18 Eagle Nest Dr
- 157 Summit St
- 400 Central St Unit 204
- 359 Central St Unit 3
- 414 Central St
- 150 Summit St
- 30 River St
- 36 Lark St
- 9 Hunt Ave