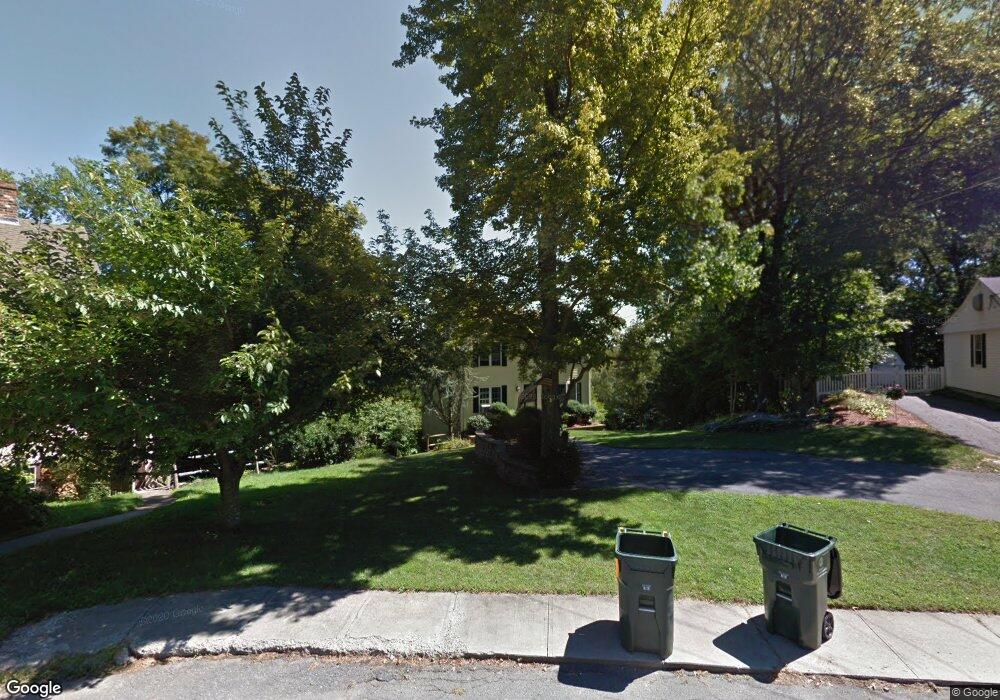
20 Park Rd Franklin, MA 02038
Downtown Franklin NeighborhoodEstimated Value: $545,000 - $597,938
3
Beds
2
Baths
1,500
Sq Ft
$382/Sq Ft
Est. Value
About This Home
This home is located at 20 Park Rd, Franklin, MA 02038 and is currently estimated at $573,235, approximately $382 per square foot. 20 Park Rd is a home located in Norfolk County with nearby schools including Remington Middle School, Franklin High School, and Benjamin Franklin Classical Charter Public School.
Ownership History
Date
Name
Owned For
Owner Type
Purchase Details
Closed on
Dec 29, 2009
Sold by
Willis Mark R and Willis Erica L
Bought by
Edmunds Brett H and Edmunds Jennifer N
Current Estimated Value
Home Financials for this Owner
Home Financials are based on the most recent Mortgage that was taken out on this home.
Original Mortgage
$251,750
Interest Rate
4.92%
Mortgage Type
Purchase Money Mortgage
Purchase Details
Closed on
Oct 30, 2006
Sold by
Lauze Dina J
Bought by
Willis Mark R and Willis Erica L
Home Financials for this Owner
Home Financials are based on the most recent Mortgage that was taken out on this home.
Original Mortgage
$246,400
Interest Rate
6.48%
Mortgage Type
Purchase Money Mortgage
Purchase Details
Closed on
May 1, 2000
Sold by
Lorusso Bros Inc
Bought by
Lauze Dina J
Home Financials for this Owner
Home Financials are based on the most recent Mortgage that was taken out on this home.
Original Mortgage
$202,400
Interest Rate
8.23%
Mortgage Type
Purchase Money Mortgage
Create a Home Valuation Report for This Property
The Home Valuation Report is an in-depth analysis detailing your home's value as well as a comparison with similar homes in the area
Home Values in the Area
Average Home Value in this Area
Purchase History
| Date | Buyer | Sale Price | Title Company |
|---|---|---|---|
| Edmunds Brett H | $265,000 | -- | |
| Willis Mark R | $308,000 | -- | |
| Lauze Dina J | $224,900 | -- |
Source: Public Records
Mortgage History
| Date | Status | Borrower | Loan Amount |
|---|---|---|---|
| Open | Lauze Dina J | $248,000 | |
| Closed | Edmunds Brett H | $251,750 | |
| Previous Owner | Willis Mark R | $246,400 | |
| Previous Owner | Willis Mark R | $46,200 | |
| Previous Owner | Lauze Dina J | $202,100 | |
| Previous Owner | Lauze Dina J | $202,400 |
Source: Public Records
Tax History Compared to Growth
Tax History
| Year | Tax Paid | Tax Assessment Tax Assessment Total Assessment is a certain percentage of the fair market value that is determined by local assessors to be the total taxable value of land and additions on the property. | Land | Improvement |
|---|---|---|---|---|
| 2025 | $6,130 | $527,500 | $239,500 | $288,000 |
| 2024 | $5,874 | $498,200 | $239,500 | $258,700 |
| 2023 | $6,120 | $486,500 | $261,500 | $225,000 |
| 2022 | $5,442 | $387,300 | $199,600 | $187,700 |
| 2021 | $5,709 | $389,700 | $207,900 | $181,800 |
| 2020 | $5,549 | $382,400 | $209,700 | $172,700 |
| 2019 | $5,229 | $356,700 | $184,000 | $172,700 |
| 2018 | $5,016 | $342,400 | $187,700 | $154,700 |
| 2017 | $4,938 | $338,700 | $184,000 | $154,700 |
| 2016 | $4,994 | $344,400 | $190,800 | $153,600 |
| 2015 | $4,838 | $326,000 | $172,400 | $153,600 |
| 2014 | $5,024 | $347,700 | $167,400 | $180,300 |
Source: Public Records
Map
Nearby Homes
- 32 Dale St
- 99 Summer St
- 7 Howard Place
- 82 Uncas Ave Unit 1
- 40 Cross St
- 1 Pond Place
- 67 Cottage St
- 70 Uncas Ave
- 64 Uncas Ave
- 90 E Central St Unit 103
- 90 E Central St Unit 106
- 90 E Central St Unit 304
- 90 E Central St Unit 202
- 90 E Central St Unit 105
- 90 E Central St Unit 301
- 374-378 Union St
- 417 Union St
- 159 E Central St
- 1 Joy St
- 1 Uncas Ave