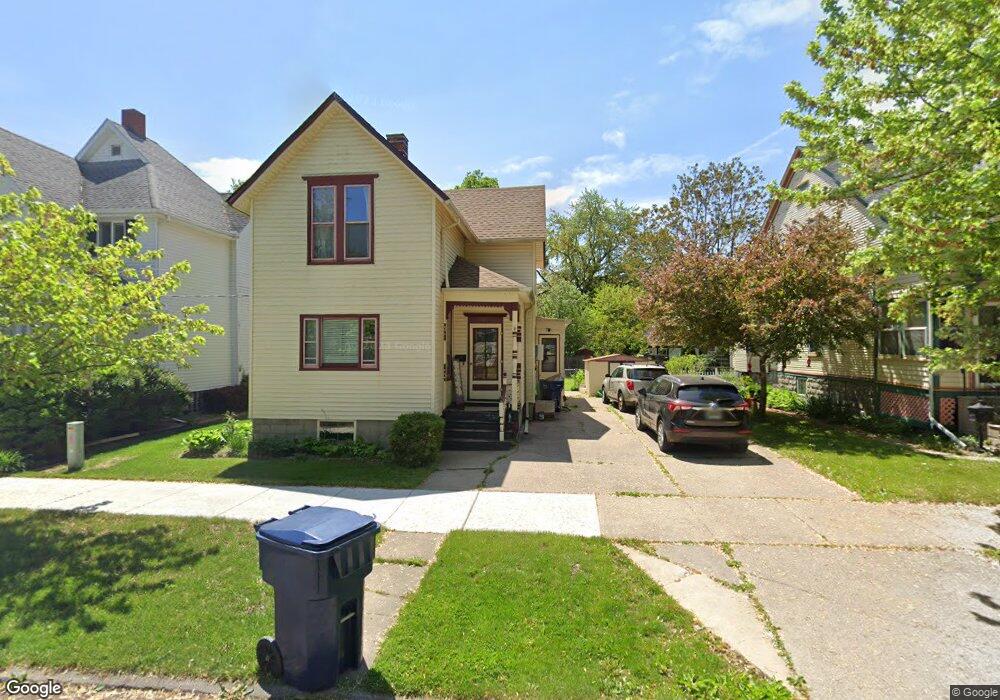
2008 5th St Unit 1 Bay City, MI 48708
Estimated Value: $116,000 - $136,000
Studio
1
Bath
1,527
Sq Ft
$84/Sq Ft
Est. Value
About This Home
This home is located at 2008 5th St Unit 1, Bay City, MI 48708 and is currently estimated at $128,958, approximately $84 per square foot. 2008 5th St Unit 1 is a home located in Bay County with nearby schools including Washington Elementary School, Handy Middle School, and Bay City Central High School.
Ownership History
Date
Name
Owned For
Owner Type
Purchase Details
Closed on
Jun 1, 2022
Sold by
Simmons Candida L
Bought by
Mercer Joseph
Current Estimated Value
Purchase Details
Closed on
Oct 18, 2020
Sold by
Kaunitz Ethel J and Kaunitz Milton A
Bought by
Simmons Candida L
Home Financials for this Owner
Home Financials are based on the most recent Mortgage that was taken out on this home.
Original Mortgage
$994
Interest Rate
2.8%
Mortgage Type
FHA
Create a Home Valuation Report for This Property
The Home Valuation Report is an in-depth analysis detailing your home's value as well as a comparison with similar homes in the area
Home Values in the Area
Average Home Value in this Area
Purchase History
| Date | Buyer | Sale Price | Title Company |
|---|---|---|---|
| Mercer Joseph | $100,000 | Diversified National Title | |
| Simmons Candida L | $69,900 | Crossroads Title |
Source: Public Records
Mortgage History
| Date | Status | Borrower | Loan Amount |
|---|---|---|---|
| Previous Owner | Simmons Candida L | $994 |
Source: Public Records
Tax History
| Year | Tax Paid | Tax Assessment Tax Assessment Total Assessment is a certain percentage of the fair market value that is determined by local assessors to be the total taxable value of land and additions on the property. | Land | Improvement |
|---|---|---|---|---|
| 2025 | $1,964 | $59,600 | $0 | $0 |
| 2024 | $1,906 | $54,400 | $0 | $0 |
| 2023 | $1,898 | $47,150 | $0 | $0 |
| 2022 | $1,702 | $37,650 | $0 | $0 |
| 2021 | $2,240 | $35,500 | $35,500 | $0 |
| 2020 | $1,366 | $34,100 | $34,100 | $0 |
| 2019 | $1,336 | $33,250 | $0 | $0 |
| 2018 | $1,323 | $32,600 | $0 | $0 |
| 2017 | $1,294 | $32,400 | $0 | $0 |
| 2016 | $1,287 | $27,850 | $0 | $27,850 |
| 2015 | $1,251 | $28,500 | $0 | $28,500 |
| 2014 | $1,251 | $30,300 | $0 | $30,300 |
Source: Public Records
Map
Nearby Homes
Your Personal Tour Guide
Ask me questions while you tour the home.