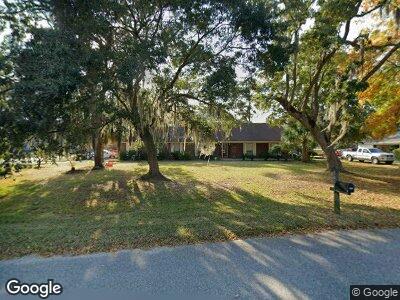
201 Debra Rd Savannah, GA 31410
Estimated Value: $487,000 - $523,497
3
Beds
2
Baths
1,842
Sq Ft
$275/Sq Ft
Est. Value
About This Home
This home is located at 201 Debra Rd, Savannah, GA 31410 and is currently estimated at $507,374, approximately $275 per square foot. 201 Debra Rd is a home located in Chatham County with nearby schools including Marshpoint Elementary School, Coastal Middle School, and Islands High School.
Ownership History
Date
Name
Owned For
Owner Type
Purchase Details
Closed on
Sep 6, 2011
Sold by
Trinh Jenny
Bought by
Truong Ma T
Current Estimated Value
Purchase Details
Closed on
Apr 21, 2011
Sold by
Not Provided
Bought by
Truong Ma T and Truong Vo Hien
Create a Home Valuation Report for This Property
The Home Valuation Report is an in-depth analysis detailing your home's value as well as a comparison with similar homes in the area
Home Values in the Area
Average Home Value in this Area
Purchase History
| Date | Buyer | Sale Price | Title Company |
|---|---|---|---|
| Truong Ma T | -- | -- | |
| Truong Ma T | -- | -- | |
| Truong Ma T | -- | -- | |
| Truong Ma T | -- | -- |
Source: Public Records
Tax History Compared to Growth
Tax History
| Year | Tax Paid | Tax Assessment Tax Assessment Total Assessment is a certain percentage of the fair market value that is determined by local assessors to be the total taxable value of land and additions on the property. | Land | Improvement |
|---|---|---|---|---|
| 2024 | $1,310 | $164,480 | $27,720 | $136,760 |
| 2023 | $907 | $175,680 | $27,720 | $147,960 |
| 2022 | $1,178 | $153,600 | $27,720 | $125,880 |
| 2021 | $1,134 | $108,160 | $27,720 | $80,440 |
| 2020 | $1,185 | $108,160 | $27,720 | $80,440 |
| 2019 | $1,330 | $108,160 | $27,720 | $80,440 |
| 2018 | $1,623 | $113,840 | $27,720 | $86,120 |
| 2017 | $1,712 | $103,280 | $28,000 | $75,280 |
| 2016 | $1,495 | $112,080 | $37,360 | $74,720 |
| 2015 | $3,318 | $97,320 | $37,360 | $59,960 |
| 2014 | $4,875 | $97,680 | $0 | $0 |
Source: Public Records
Map
Nearby Homes
- 6 Harpoon Ct Unit 50
- 39 Helmsman Ct
- 6921 Johnny Mercer Blvd
- 4 Calibogue Rd
- 203 Quarterman Dr
- 9 Cypress Cove
- 22 Dockside Dr
- 7201 Tropical Way
- 236 Suncrest Blvd
- 0 Johnny Mercer Blvd Unit 322107
- 7313 Tropical Way
- 112 Copperfield Dr N
- 109 Blue Heron Dr
- 138 Kaitlyn Cove
- 105 Shoals Dr
- 61 Palmer Blvd
- 125 Penn Station
- 13 Copperfield Dr S
- 129 Penn Station
- 13 River Oaks Rd