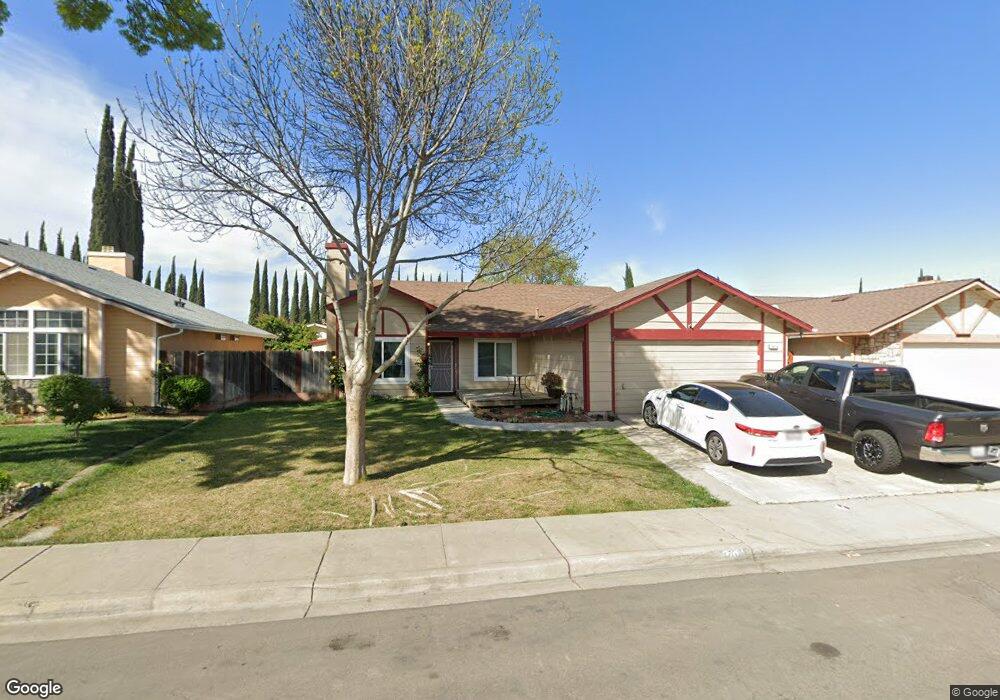
201 Paramatta Dr Patterson, CA 95363
Estimated Value: $396,000 - $446,000
4
Beds
2
Baths
1,514
Sq Ft
$283/Sq Ft
Est. Value
About This Home
This home is located at 201 Paramatta Dr, Patterson, CA 95363 and is currently estimated at $428,971, approximately $283 per square foot. 201 Paramatta Dr is a home located in Stanislaus County with nearby schools including Las Palmas Elementary School, Creekside Middle School, and Patterson High School.
Ownership History
Date
Name
Owned For
Owner Type
Purchase Details
Closed on
Feb 24, 2021
Sold by
Young Cheryl L
Bought by
Young Cheryl L and Cheryl L Young Living Trust
Current Estimated Value
Home Financials for this Owner
Home Financials are based on the most recent Mortgage that was taken out on this home.
Original Mortgage
$133,000
Outstanding Balance
$98,102
Interest Rate
2.8%
Mortgage Type
New Conventional
Estimated Equity
$330,869
Purchase Details
Closed on
Aug 22, 2014
Sold by
Young Cheryl L
Bought by
Young Cheryl L and The Cheryl L Young Living Trus
Purchase Details
Closed on
Nov 28, 2011
Sold by
Chung Richard D and Chung Cheryl L
Bought by
Young Cheryl L
Purchase Details
Closed on
Sep 2, 2011
Sold by
Chung Richard D
Bought by
Young Cheryl L
Purchase Details
Closed on
Jun 3, 2005
Sold by
Chung Richard D and Chung Cheryl L
Bought by
Chung Richard D and Chung Cheryl L
Create a Home Valuation Report for This Property
The Home Valuation Report is an in-depth analysis detailing your home's value as well as a comparison with similar homes in the area
Home Values in the Area
Average Home Value in this Area
Purchase History
| Date | Buyer | Sale Price | Title Company |
|---|---|---|---|
| Young Cheryl L | -- | Accommodation | |
| Young Cheryl L | -- | Fidelity Natl Ttl Orange Cnt | |
| Young Cheryl L | -- | None Available | |
| Young Cheryl L | -- | None Available | |
| Young Cheryl L | -- | None Available | |
| Chung Richard D | -- | -- |
Source: Public Records
Mortgage History
| Date | Status | Borrower | Loan Amount |
|---|---|---|---|
| Open | Young Cheryl L | $133,000 |
Source: Public Records
Tax History
| Year | Tax Paid | Tax Assessment Tax Assessment Total Assessment is a certain percentage of the fair market value that is determined by local assessors to be the total taxable value of land and additions on the property. | Land | Improvement |
|---|---|---|---|---|
| 2025 | $2,437 | $202,646 | $58,161 | $144,485 |
| 2024 | $2,430 | $198,673 | $57,021 | $141,652 |
| 2023 | $2,378 | $194,778 | $55,903 | $138,875 |
| 2022 | $2,246 | $190,959 | $54,807 | $136,152 |
| 2021 | $2,228 | $187,216 | $53,733 | $133,483 |
| 2020 | $2,217 | $185,298 | $53,183 | $132,115 |
| 2019 | $2,184 | $181,666 | $52,141 | $129,525 |
| 2018 | $2,082 | $178,105 | $51,119 | $126,986 |
| 2017 | $1,962 | $174,614 | $50,117 | $124,497 |
| 2016 | $1,910 | $171,191 | $49,135 | $122,056 |
| 2015 | $1,875 | $168,620 | $48,397 | $120,223 |
| 2014 | $1,737 | $156,000 | $25,000 | $131,000 |
Source: Public Records
Map
Nearby Homes
- 250 E Las Palmas Ave Unit 13
- 538 Chesterfield Dr
- 600 Sears Dr
- 517 Nordell Place
- 0 Orange Ave
- 108 N 6th St
- 814 Bogdanich Pkwy
- 1430 Walnut Ave
- 855 Toyon Ln
- 518 Bedfordshire Dr
- 449 D Arpino Ct
- 564 Millwood Dr
- 15707 S 9th St
- 445 M St
- 16012 Sycamore Ave
- 559 S Del Puerto Ave
- 701 N 3rd St
- 708 Bonneau Ct
- 604 Kinshire Way
- 617 Mansfield Dr
- 205 Paramatta Dr
- 143 Paramatta Dr
- 139 Paramatta Dr
- 209 Paramatta Dr
- 144 Paramatta Dr
- 200 Paramatta Dr
- 140 Paramatta Dr
- 135 Paramatta Dr
- 213 Paramatta Dr
- 204 Paramatta Dr
- 507 Chesterfield Dr
- 131 Paramatta Dr
- 217 Paramatta Dr
- 517 Westfield Place
- 516 Westfield Place
- 132 Paramatta Dr
- 511 Chesterfield Dr
- 127 Paramatta Dr
- 520 Messer Place
- 128 Paramatta Dr
Your Personal Tour Guide
Ask me questions while you tour the home.