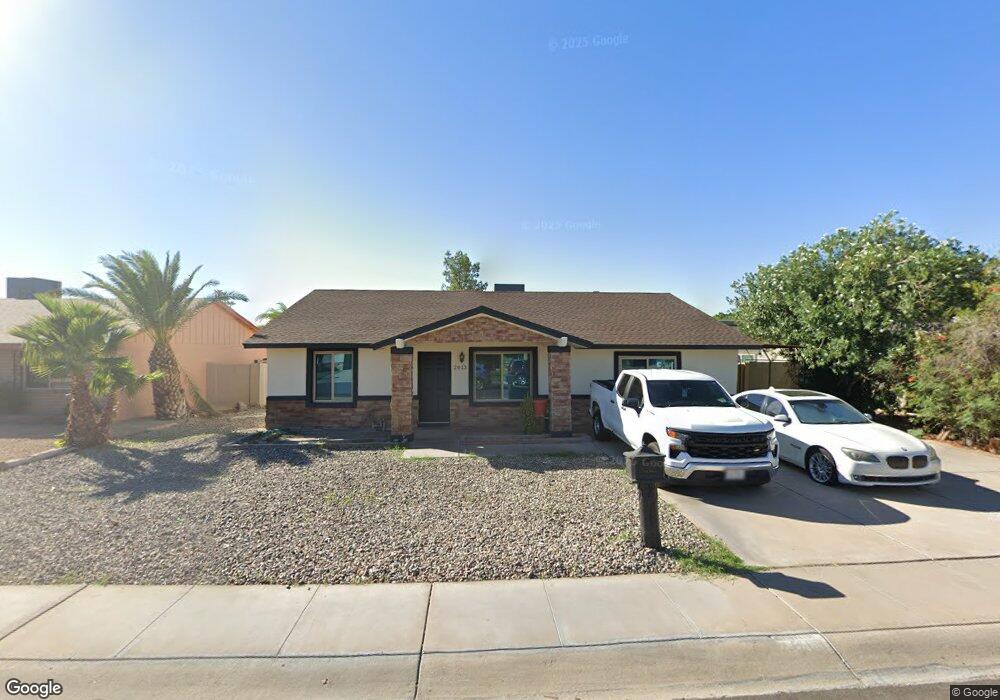
2013 E Colgate Dr Tempe, AZ 85283
The Lakes NeighborhoodEstimated Value: $507,180 - $530,000
3
Beds
2
Baths
1,840
Sq Ft
$283/Sq Ft
Est. Value
About This Home
This home is located at 2013 E Colgate Dr, Tempe, AZ 85283 and is currently estimated at $521,045, approximately $283 per square foot. 2013 E Colgate Dr is a home located in Maricopa County with nearby schools including Fuller Elementary School, Fees College Preparatory Middle School, and Marcos De Niza High School.
Ownership History
Date
Name
Owned For
Owner Type
Purchase Details
Closed on
Aug 2, 2007
Sold by
Torres Ruben
Bought by
Torres Nellie and Torres Ruben
Current Estimated Value
Home Financials for this Owner
Home Financials are based on the most recent Mortgage that was taken out on this home.
Original Mortgage
$246,500
Outstanding Balance
$185,109
Interest Rate
10.75%
Mortgage Type
New Conventional
Estimated Equity
$335,936
Purchase Details
Closed on
Jun 23, 2004
Sold by
Torres Nellie
Bought by
Torres Ruben
Home Financials for this Owner
Home Financials are based on the most recent Mortgage that was taken out on this home.
Original Mortgage
$142,500
Interest Rate
6.27%
Mortgage Type
New Conventional
Purchase Details
Closed on
Dec 5, 1997
Sold by
Conrado Julio and Conrado Susana
Bought by
Torres Ruben and Torres Nellie
Home Financials for this Owner
Home Financials are based on the most recent Mortgage that was taken out on this home.
Original Mortgage
$91,000
Interest Rate
10.87%
Create a Home Valuation Report for This Property
The Home Valuation Report is an in-depth analysis detailing your home's value as well as a comparison with similar homes in the area
Home Values in the Area
Average Home Value in this Area
Purchase History
| Date | Buyer | Sale Price | Title Company |
|---|---|---|---|
| Torres Nellie | -- | Camelback Title Agency Llc | |
| Torres Ruben | -- | Lawyers Title Insurance Corp | |
| Torres Ruben | -- | Nations Title Insurance |
Source: Public Records
Mortgage History
| Date | Status | Borrower | Loan Amount |
|---|---|---|---|
| Open | Torres Nellie | $246,500 | |
| Closed | Torres Ruben | $142,500 | |
| Closed | Torres Ruben | $91,000 |
Source: Public Records
Tax History
| Year | Tax Paid | Tax Assessment Tax Assessment Total Assessment is a certain percentage of the fair market value that is determined by local assessors to be the total taxable value of land and additions on the property. | Land | Improvement |
|---|---|---|---|---|
| 2025 | $2,277 | $21,843 | -- | -- |
| 2024 | $2,089 | $20,803 | -- | -- |
| 2023 | $2,089 | $36,450 | $7,290 | $29,160 |
| 2022 | $1,995 | $27,760 | $5,550 | $22,210 |
| 2021 | $2,035 | $25,470 | $5,090 | $20,380 |
| 2020 | $1,967 | $22,750 | $4,550 | $18,200 |
| 2019 | $1,929 | $22,420 | $4,480 | $17,940 |
| 2018 | $1,877 | $20,370 | $4,070 | $16,300 |
| 2017 | $1,819 | $18,450 | $3,690 | $14,760 |
| 2016 | $1,810 | $17,850 | $3,570 | $14,280 |
| 2015 | $1,751 | $15,570 | $3,110 | $12,460 |
Source: Public Records
Map
Nearby Homes
- 5352 S Country Club Way
- 2030 E Colgate Dr
- 2041 E Radcliffe Dr
- 1970 E Duke Dr
- 2024 E Rice Dr
- 1919 E Auburn Dr
- 1924 E Duke Dr
- 2116 E Colgate Dr
- 1867 E Oxford Dr
- 1983 E Dunbar Dr
- 2132 E Tulane Dr
- 1870 E Tulane Dr Unit 11
- 1959 E Dunbar Dr
- 2137 E Cornell Dr
- 2127 E Ellis Dr
- 1821 E Colgate Dr
- 1831 E Cornell Dr
- 5817 S Siesta Ln
- 1823 E Cornell Dr Unit 11
- 2044 S Don Carlos Unit 7
- 2019 E Colgate Dr
- 2007 E Colgate Dr
- 2010 E Radcliffe Dr
- 2025 E Colgate Dr
- 2016 E Radcliffe Dr
- 2001 E Colgate Dr
- 2012 E Colgate Dr
- 2018 E Colgate Dr
- 2004 E Radcliffe Dr
- 2006 E Colgate Dr
- 2024 E Colgate Dr
- 2022 E Radcliffe Dr
- 2031 E Colgate Dr
- 5327 S Country Club Way
- 2028 E Radcliffe Dr
- 2017 E Harvard Dr
- 2037 E Colgate Dr
- 2013 E Harvard Dr
- 5359 S Country Club Way
- 5321 S Country Club Way
Your Personal Tour Guide
Ask me questions while you tour the home.