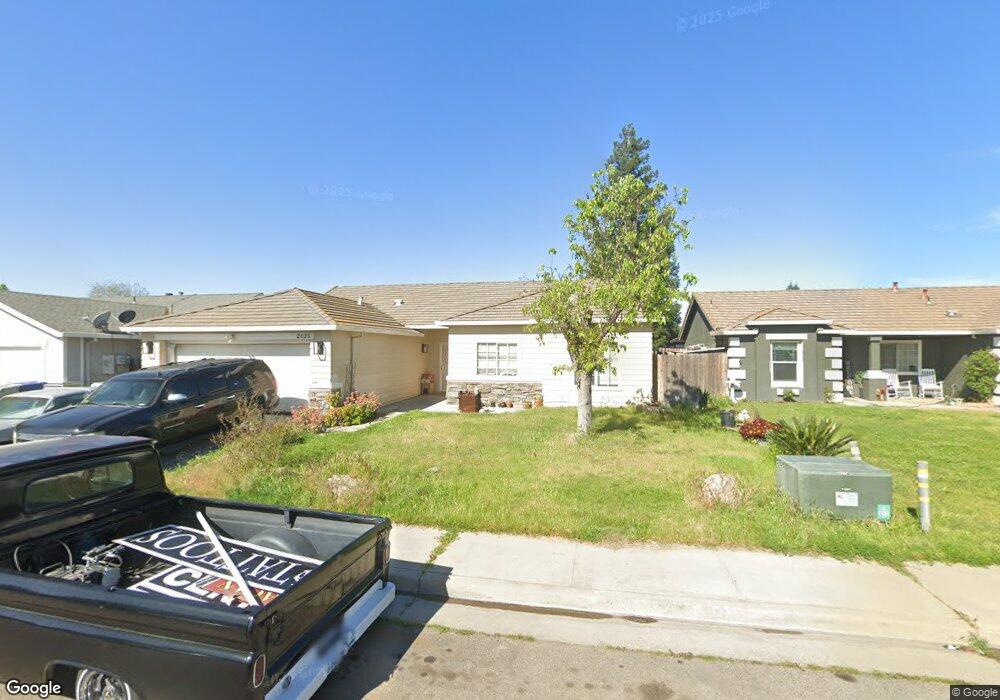
2025 Magpie Ct Atwater, CA 95301
Estimated Value: $307,000 - $473,000
4
Beds
2
Baths
1,945
Sq Ft
$215/Sq Ft
Est. Value
About This Home
This home is located at 2025 Magpie Ct, Atwater, CA 95301 and is currently estimated at $417,572, approximately $214 per square foot. 2025 Magpie Ct is a home located in Merced County with nearby schools including Bellevue Elementary School, Buhach Colony High School, and King's Christian Academy.
Ownership History
Date
Name
Owned For
Owner Type
Purchase Details
Closed on
Dec 7, 2009
Sold by
Hsbc Mortgage Services Inc
Bought by
Perez Maribel
Current Estimated Value
Home Financials for this Owner
Home Financials are based on the most recent Mortgage that was taken out on this home.
Original Mortgage
$128,627
Interest Rate
5.03%
Mortgage Type
FHA
Purchase Details
Closed on
Sep 17, 2009
Sold by
Howard Joann
Bought by
Hsbc Mortgage Services Inc
Purchase Details
Closed on
Jan 5, 2004
Sold by
Avila Lucas A
Bought by
Howard Joann
Home Financials for this Owner
Home Financials are based on the most recent Mortgage that was taken out on this home.
Original Mortgage
$190,400
Interest Rate
7%
Mortgage Type
Purchase Money Mortgage
Create a Home Valuation Report for This Property
The Home Valuation Report is an in-depth analysis detailing your home's value as well as a comparison with similar homes in the area
Home Values in the Area
Average Home Value in this Area
Purchase History
| Date | Buyer | Sale Price | Title Company |
|---|---|---|---|
| Perez Maribel | $131,000 | Chicago Title Company | |
| Hsbc Mortgage Services Inc | $111,869 | Accommodation | |
| Howard Joann | $238,000 | Alliance Title Company |
Source: Public Records
Mortgage History
| Date | Status | Borrower | Loan Amount |
|---|---|---|---|
| Previous Owner | Perez Maribel | $128,627 | |
| Previous Owner | Howard Joann | $190,400 | |
| Closed | Howard Joann | $47,600 |
Source: Public Records
Tax History Compared to Growth
Tax History
| Year | Tax Paid | Tax Assessment Tax Assessment Total Assessment is a certain percentage of the fair market value that is determined by local assessors to be the total taxable value of land and additions on the property. | Land | Improvement |
|---|---|---|---|---|
| 2025 | $1,858 | $169,082 | $12,901 | $156,181 |
| 2024 | $1,858 | $165,768 | $12,649 | $153,119 |
| 2023 | $1,812 | $162,518 | $12,401 | $150,117 |
| 2022 | $1,792 | $159,332 | $12,158 | $147,174 |
| 2021 | $1,795 | $156,209 | $11,920 | $144,289 |
| 2020 | $1,775 | $154,608 | $11,798 | $142,810 |
| 2019 | $1,702 | $151,577 | $11,567 | $140,010 |
| 2018 | $1,661 | $148,606 | $11,341 | $137,265 |
| 2017 | $1,607 | $145,693 | $11,119 | $134,574 |
| 2016 | $1,616 | $142,837 | $10,901 | $131,936 |
| 2015 | $1,597 | $140,693 | $10,738 | $129,955 |
| 2014 | $2,631 | $137,938 | $10,528 | $127,410 |
Source: Public Records
Map
Nearby Homes
- 1012 Huntingdale Way
- 1881 Valley St
- 851 Boulder Dr
- 1620 Fairway Dr
- 562 Curtis Ct
- 1832 Vann Terrace
- 0 N Buhach Rd Unit MC25134355
- 1675 Almador Terrace
- 1943 Pollitt Ct
- 352 Terri Dr
- 190 Tammy Dr
- 2809 Buhach Rd Unit 17
- 76 Rancho Grande Cir
- 5200 Crest Rd Unit 91
- 5200 Crest Rd
- 5200 Crest Rd Unit 96
- 2900 Muir Ave Unit 85
- 152 Seville Ct
- 152 Seville Ct Unit 152
- 3650 Santa fe Dr