Estimated Value: $875,880 - $974,000
4
Beds
3
Baths
3,340
Sq Ft
$276/Sq Ft
Est. Value
About This Home
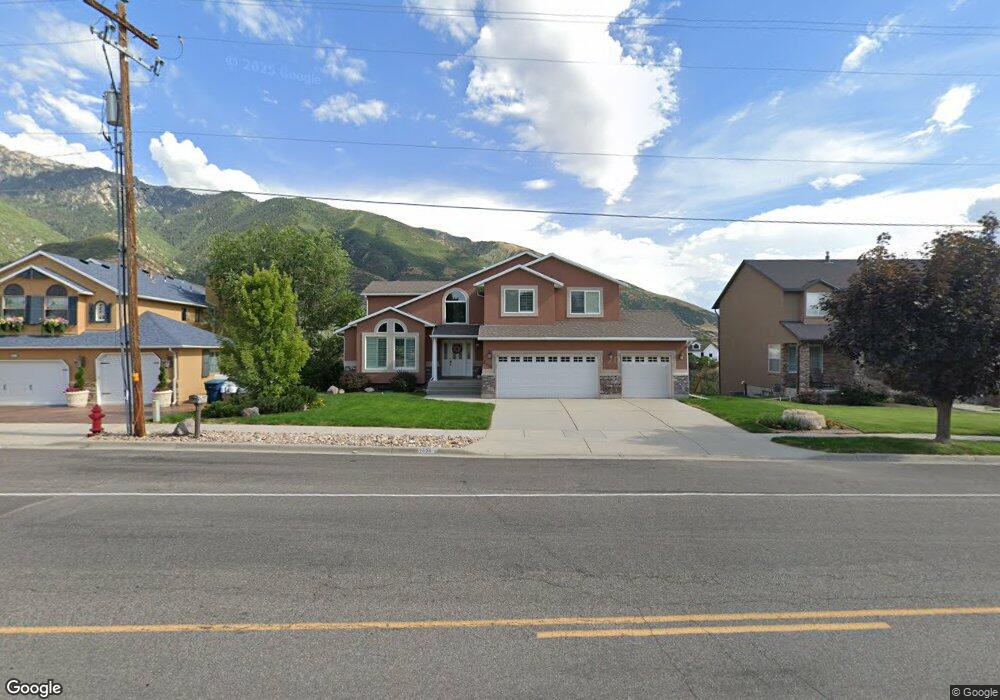
This home is located at 2028 E 11340 S, Sandy, UT 84092 and is currently estimated at $922,220, approximately $276 per square foot. 2028 E 11340 S is a home located in Salt Lake County with nearby schools including Sunrise Elementary School, Bell Canyon Montessori School, and Challenger School - Sandy.
Ownership History
Date
Name
Owned For
Owner Type
Purchase Details
Closed on
May 25, 2017
Sold by
Raczka Brett and Raczka Lori
Bought by
Raczka Brett and Raczka Lori
Current Estimated Value
Purchase Details
Closed on
Sep 13, 2016
Sold by
Raczka Brett M and Raczka Lori
Bought by
Eaczka Brett and Raczka Lori
Home Financials for this Owner
Home Financials are based on the most recent Mortgage that was taken out on this home.
Original Mortgage
$319,325
Outstanding Balance
$234,198
Interest Rate
3.43%
Mortgage Type
New Conventional
Estimated Equity
$688,022
Purchase Details
Closed on
Jul 25, 2014
Sold by
Bertram Ronald K and Bertram Marylee C
Bought by
Raczka Brett M and Raczka Lori
Home Financials for this Owner
Home Financials are based on the most recent Mortgage that was taken out on this home.
Original Mortgage
$330,000
Interest Rate
4.13%
Mortgage Type
New Conventional
Create a Home Valuation Report for This Property
The Home Valuation Report is an in-depth analysis detailing your home's value as well as a comparison with similar homes in the area
Home Values in the Area
Average Home Value in this Area
Purchase History
| Date | Buyer | Sale Price | Title Company |
|---|---|---|---|
| Raczka Brett | -- | None Available | |
| Eaczka Brett | -- | First American Title | |
| Raczka Brett M | -- | Bonneville Superior Title |
Source: Public Records
Mortgage History
| Date | Status | Borrower | Loan Amount |
|---|---|---|---|
| Open | Eaczka Brett | $319,325 | |
| Previous Owner | Raczka Brett M | $330,000 |
Source: Public Records
Tax History
| Year | Tax Paid | Tax Assessment Tax Assessment Total Assessment is a certain percentage of the fair market value that is determined by local assessors to be the total taxable value of land and additions on the property. | Land | Improvement |
|---|---|---|---|---|
| 2025 | $4,106 | $815,000 | $244,400 | $570,600 |
| 2024 | $4,106 | $776,300 | $235,300 | $541,000 |
| 2023 | $3,788 | $715,700 | $226,200 | $489,500 |
| 2022 | $3,822 | $705,900 | $221,800 | $484,100 |
| 2021 | $3,421 | $538,000 | $192,900 | $345,100 |
| 2020 | $3,426 | $508,800 | $186,400 | $322,400 |
| 2019 | $3,465 | $502,300 | $175,800 | $326,500 |
| 2016 | $3,052 | $428,500 | $175,800 | $252,700 |
Source: Public Records
Map
Nearby Homes
- 11129 S 2125 E
- 2234 E Willow Brook Way
- 11318 Canyon Falls Ln
- 2148 E Pinecrest Ln
- 2192 E High Mesa Dr
- 11382 S Canyon Falls Ln
- 2122 Wasatch Blvd
- 7 Rollingwood Ln
- 2232 E Lone Eagle Ln
- 11446 S 2320 E
- 11779 S Windcroft Ct
- 1653 Crescent View Dr
- 1 Quietwood Ln
- 16 Gatehouse Ln
- 11341 S Silver Buckle Way
- 2026 E 10765 S
- 5 Quietwood Ln
- 11683 S 2460 E
- 35 E Lone Hollow Dr
- 2342 Charros Rd
- 2016 E 11340 S
- 2042 E 11340 S
- 2002 E 11340 S
- 1992 E 11340 S
- 11305 Wyngate Ln
- 11305 S Wyngate Ln
- 1985 E 11340 S
- 11289 S Wyngate Ln
- 11289 Wyngate Ln
- 1978 E 11340 S
- 11306 Wyngate Ln
- 11277 Wyngate Ln
- 2010 Tall Pines Way
- 11292 Wyngate Ln
- 2089 E Kathy Dr Unit 1
- 2089 E Kathy Dr
- 2034 Tall Pines Way
- 11265 S Wyngate Ln
- 11265 Wyngate Ln
- 11352 S Castle Ridge Dr Unit 3
Your Personal Tour Guide
Ask me questions while you tour the home.