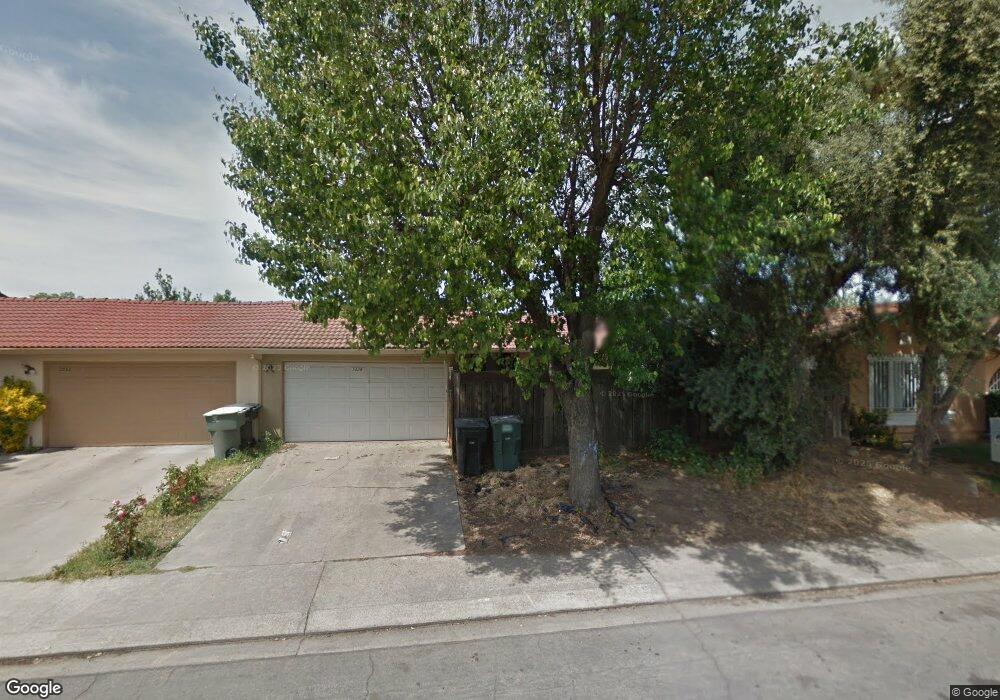
2029 Marlow St Modesto, CA 95351
West Modesto NeighborhoodEstimated Value: $241,000 - $349,000
2
Beds
2
Baths
1,107
Sq Ft
$269/Sq Ft
Est. Value
About This Home
This home is located at 2029 Marlow St, Modesto, CA 95351 and is currently estimated at $297,819, approximately $269 per square foot. 2029 Marlow St is a home located in Stanislaus County with nearby schools including Harriette Kirschen Elementary School, Mark Twain Junior High School, and Modesto High School.
Ownership History
Date
Name
Owned For
Owner Type
Purchase Details
Closed on
May 19, 2011
Sold by
Lourenco Joe
Bought by
Lourenco Joe C and Lourenco Nelly A
Current Estimated Value
Purchase Details
Closed on
Oct 20, 2008
Sold by
Lourenco Nelly A
Bought by
Lourenco Joe
Purchase Details
Closed on
Oct 16, 2008
Sold by
Bank Of New York
Bought by
Lourenco Joe
Purchase Details
Closed on
Dec 4, 2007
Sold by
Scroggins Shirley
Bought by
Bank Of New York and The Noteholders Cwabs Inc
Purchase Details
Closed on
Jul 6, 2000
Sold by
Story Rick C and Canda Joy
Bought by
Scroggins Shirley
Home Financials for this Owner
Home Financials are based on the most recent Mortgage that was taken out on this home.
Original Mortgage
$64,000
Interest Rate
11.29%
Create a Home Valuation Report for This Property
The Home Valuation Report is an in-depth analysis detailing your home's value as well as a comparison with similar homes in the area
Home Values in the Area
Average Home Value in this Area
Purchase History
| Date | Buyer | Sale Price | Title Company |
|---|---|---|---|
| Lourenco Joe C | -- | None Available | |
| Lourenco Joe | -- | First American Title Ins Co | |
| Lourenco Joe | $37,000 | First American Title Ins Co | |
| Bank Of New York | $199,626 | Landsafe Title | |
| Scroggins Shirley | $80,000 | Stewart Title |
Source: Public Records
Mortgage History
| Date | Status | Borrower | Loan Amount |
|---|---|---|---|
| Previous Owner | Scroggins Shirley | $64,000 | |
| Closed | Scroggins Shirley | $16,000 |
Source: Public Records
Tax History
| Year | Tax Paid | Tax Assessment Tax Assessment Total Assessment is a certain percentage of the fair market value that is determined by local assessors to be the total taxable value of land and additions on the property. | Land | Improvement |
|---|---|---|---|---|
| 2025 | $557 | $47,632 | $38,625 | $9,007 |
| 2024 | $532 | $46,699 | $37,868 | $8,831 |
| 2023 | $524 | $45,784 | $37,126 | $8,658 |
| 2022 | $511 | $44,888 | $36,399 | $8,489 |
| 2021 | $481 | $44,009 | $35,686 | $8,323 |
| 2020 | $491 | $43,559 | $35,321 | $8,238 |
| 2019 | $479 | $42,706 | $34,629 | $8,077 |
| 2018 | $456 | $41,869 | $33,950 | $7,919 |
| 2017 | $445 | $41,049 | $33,285 | $7,764 |
| 2016 | $437 | $40,245 | $32,633 | $7,612 |
| 2015 | $431 | $39,641 | $32,143 | $7,498 |
| 2014 | $424 | $38,866 | $31,514 | $7,352 |
Source: Public Records
Map
Nearby Homes
- 2104 Olive Branch Dr
- 1805 Vernon Ave
- 1908 Vernon Ave
- 1809 Taos Ct
- 1416 Victoria Dr
- 1805 Kenneth St
- 1820 Kenneth St
- 1633 Kazmir Ct
- 1016 Lombardy Dr
- 2508 Paradise Rd
- 1546 Bedford Ave
- 1626 Vicksburg St
- 812 Clementa Way
- 1305 Levi Dr
- 821 Sutter Ave
- 1200 S Carpenter Rd Unit 42
- 1200 S Carpenter Rd Unit 18
- 1200 S Carpenter Rd
- 1200 S Carpenter Rd Unit 51
- 1200 S Carpenter Rd Unit 4
- 2033 Marlow St
- 2025 Marlow St
- 2036 Olive Branch Dr
- 2040 Olive Branch Dr
- 2032 Olive Branch Dr
- 2037 Marlow St
- 2021 Marlow St
- 2028 Marlow St
- 2044 Olive Branch Dr
- 2024 Marlow St
- 2028 Olive Branch Dr
- 2032 Marlow St
- 2041 Marlow St
- 2017 Marlow St
- 2048 Olive Branch Dr
- 2025 Minoso Dr
- 2016 Marlow St
- 2024 Olive Branch Dr
- 705 Lacross Ct
- 2013 Marlow St
Your Personal Tour Guide
Ask me questions while you tour the home.