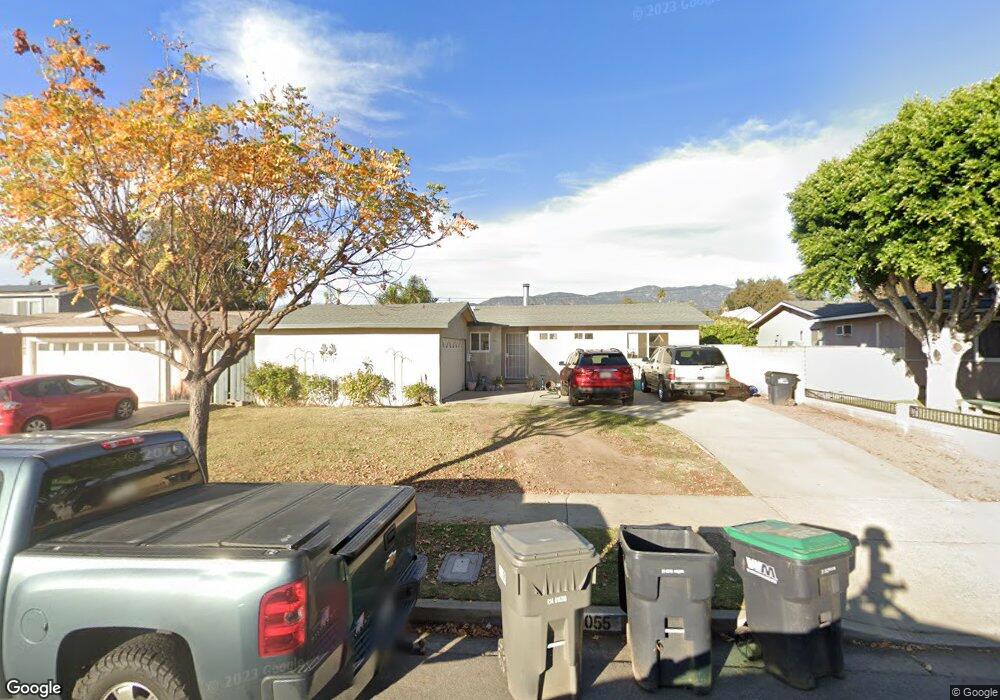
2055 11th St La Verne, CA 91750
Old Town NeighborhoodEstimated Value: $739,103 - $884,000
4
Beds
2
Baths
1,386
Sq Ft
$593/Sq Ft
Est. Value
About This Home
This home is located at 2055 11th St, La Verne, CA 91750 and is currently estimated at $822,276, approximately $593 per square foot. 2055 11th St is a home located in Los Angeles County with nearby schools including J. Marion Roynon Elementary School, Ramona Middle School, and Bonita High School.
Ownership History
Date
Name
Owned For
Owner Type
Purchase Details
Closed on
Apr 17, 2021
Sold by
Zirbes Georgina and Zirhes Dennis M
Bought by
Zirbes Georgina
Current Estimated Value
Home Financials for this Owner
Home Financials are based on the most recent Mortgage that was taken out on this home.
Original Mortgage
$210,000
Outstanding Balance
$189,605
Interest Rate
3%
Mortgage Type
New Conventional
Estimated Equity
$632,671
Purchase Details
Closed on
Feb 8, 2001
Sold by
Marlou Llc
Bought by
Zirbes Georgina and Zirbes Dennis M
Home Financials for this Owner
Home Financials are based on the most recent Mortgage that was taken out on this home.
Original Mortgage
$164,000
Interest Rate
8.71%
Purchase Details
Closed on
Jan 31, 2001
Sold by
Kane Cindy M
Bought by
Marlou Llc
Home Financials for this Owner
Home Financials are based on the most recent Mortgage that was taken out on this home.
Original Mortgage
$164,000
Interest Rate
8.71%
Purchase Details
Closed on
Dec 8, 2000
Sold by
Kane Robert M
Bought by
Kane Robert Michael and Kane Cindy M
Create a Home Valuation Report for This Property
The Home Valuation Report is an in-depth analysis detailing your home's value as well as a comparison with similar homes in the area
Home Values in the Area
Average Home Value in this Area
Purchase History
| Date | Buyer | Sale Price | Title Company |
|---|---|---|---|
| Zirbes Georgina | -- | Amrock | |
| Zirbes Georgina | $205,000 | United Title Company | |
| Marlou Llc | $135,000 | United Title Company | |
| Kane Michael R | -- | United Title Company | |
| Kane Robert Michael | -- | Fidelity Title |
Source: Public Records
Mortgage History
| Date | Status | Borrower | Loan Amount |
|---|---|---|---|
| Open | Zirbes Georgina | $210,000 | |
| Previous Owner | Zirbes Georgina | $164,000 |
Source: Public Records
Tax History Compared to Growth
Tax History
| Year | Tax Paid | Tax Assessment Tax Assessment Total Assessment is a certain percentage of the fair market value that is determined by local assessors to be the total taxable value of land and additions on the property. | Land | Improvement |
|---|---|---|---|---|
| 2025 | $6,410 | $547,937 | $424,250 | $123,687 |
| 2024 | $6,410 | $537,194 | $415,932 | $121,262 |
| 2023 | $6,266 | $526,662 | $407,777 | $118,885 |
| 2022 | $3,650 | $291,068 | $180,038 | $111,030 |
| 2021 | $3,577 | $285,361 | $176,508 | $108,853 |
| 2020 | $3,528 | $282,436 | $174,699 | $107,737 |
| 2019 | $3,506 | $276,899 | $171,274 | $105,625 |
| 2018 | $3,288 | $271,470 | $167,916 | $103,554 |
| 2016 | $3,158 | $260,931 | $161,397 | $99,534 |
| 2015 | $3,106 | $257,012 | $158,973 | $98,039 |
| 2014 | $3,078 | $251,978 | $155,859 | $96,119 |
Source: Public Records
Map
Nearby Homes
- 1963 10th St
- 1907 Canopy Ln
- 2302 8th St
- 2376 Lomeli Ln
- 2640 F St
- 3015 Knollwood Ave Unit 4
- 3036 Knollwood Ave
- 1613 Paseo Ave
- 3380 Lucero Ave
- 3043 N White Ave
- 3025 N White Ave
- 2810 Nordland Ave
- 0 Bonita Ave
- 1753 Eaton Place
- 2358 Bonita Ave
- 3788 Verdana Cir
- 4095 Fruit St Unit Spc 328
- 4095 Fruit St Unit 613
- 4095 Fruit St Unit 606
- 4095 Fruit St Unit 108