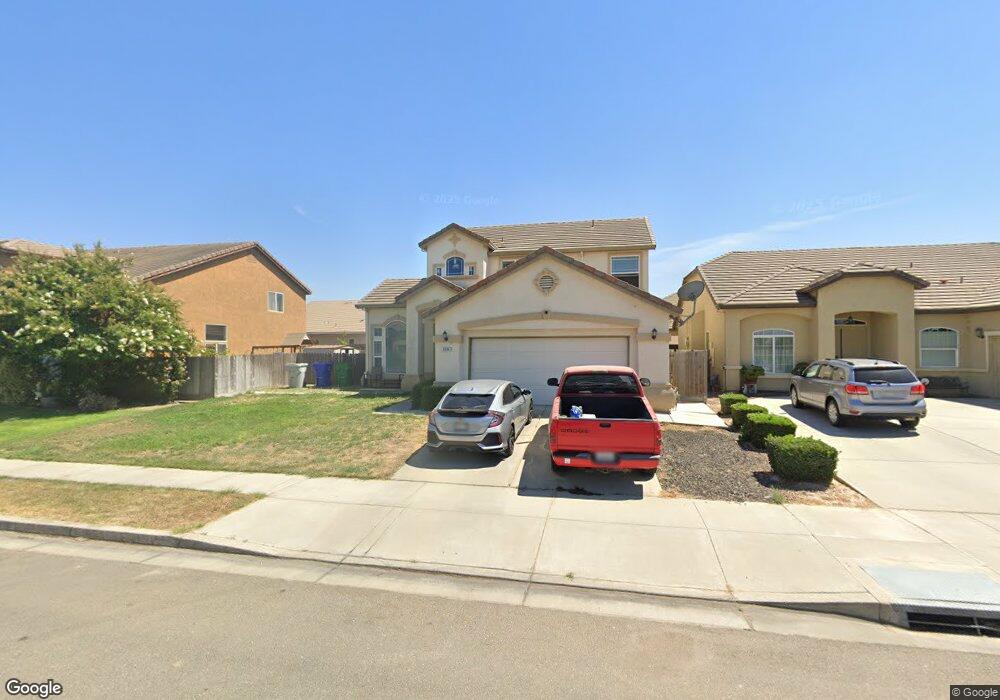
2064 Nebela Dr Atwater, CA 95301
Estimated Value: $391,000 - $516,000
4
Beds
4
Baths
2,102
Sq Ft
$229/Sq Ft
Est. Value
About This Home
This home is located at 2064 Nebela Dr, Atwater, CA 95301 and is currently estimated at $480,915, approximately $228 per square foot. 2064 Nebela Dr is a home located in Merced County with nearby schools including Franklin Elementary School, Rudolph Rivera Middle School, and Buhach Colony High School.
Ownership History
Date
Name
Owned For
Owner Type
Purchase Details
Closed on
Apr 23, 2014
Sold by
Emmanuel Gerry F
Bought by
Coronado Ruben and Coronado Alexandria
Current Estimated Value
Home Financials for this Owner
Home Financials are based on the most recent Mortgage that was taken out on this home.
Original Mortgage
$235,653
Outstanding Balance
$179,208
Interest Rate
4.35%
Mortgage Type
FHA
Estimated Equity
$301,707
Purchase Details
Closed on
Mar 29, 2011
Sold by
Piro Enterprises Inc
Bought by
Gerry F Emmanuel M D Inc Money Purchase
Purchase Details
Closed on
Feb 27, 2007
Sold by
Piro Helen
Bought by
Piro Ramson
Purchase Details
Closed on
Feb 20, 2007
Sold by
Piro Ramson
Bought by
Piro Enterprises Inc
Create a Home Valuation Report for This Property
The Home Valuation Report is an in-depth analysis detailing your home's value as well as a comparison with similar homes in the area
Home Values in the Area
Average Home Value in this Area
Purchase History
| Date | Buyer | Sale Price | Title Company |
|---|---|---|---|
| Coronado Ruben | $240,000 | First American Title Company | |
| Gerry F Emmanuel M D Inc Money Purchase | $330,000 | Stewart Title Of California | |
| Piro Ramson | -- | Alliance Title Company | |
| Piro Enterprises Inc | -- | Alliance Title Company |
Source: Public Records
Mortgage History
| Date | Status | Borrower | Loan Amount |
|---|---|---|---|
| Open | Coronado Ruben | $235,653 |
Source: Public Records
Tax History Compared to Growth
Tax History
| Year | Tax Paid | Tax Assessment Tax Assessment Total Assessment is a certain percentage of the fair market value that is determined by local assessors to be the total taxable value of land and additions on the property. | Land | Improvement |
|---|---|---|---|---|
| 2025 | $4,383 | $317,587 | $42,255 | $275,332 |
| 2024 | $4,383 | $311,361 | $41,427 | $269,934 |
| 2023 | $4,364 | $305,257 | $40,615 | $264,642 |
| 2022 | $4,152 | $299,272 | $39,819 | $259,453 |
| 2021 | $4,111 | $293,405 | $39,039 | $254,366 |
| 2020 | $4,103 | $290,397 | $38,639 | $251,758 |
| 2019 | $4,048 | $284,704 | $37,882 | $246,822 |
| 2018 | $3,751 | $279,123 | $37,140 | $241,983 |
| 2017 | $3,839 | $273,651 | $36,412 | $237,239 |
| 2016 | $3,780 | $268,287 | $35,699 | $232,588 |
| 2015 | $3,594 | $244,794 | $35,699 | $209,095 |
| 2014 | $2,298 | $125,412 | $11,495 | $113,917 |
Source: Public Records
Map
Nearby Homes
- 2809 Buhach Rd Unit 17
- 2001 Sola Ct
- 0 N Buhach Rd Unit MC25134355
- 1012 Huntingdale Way
- 5200 Crest Rd Unit 91
- 5200 Crest Rd
- 5200 Crest Rd Unit 96
- 851 Boulder Dr
- 1881 Valley St
- 1620 Fairway Dr
- 2900 Muir Ave Unit 85
- 1943 Faxon Dr
- 1939 Faxon Dr
- 562 Curtis Ct
- 1832 Vann Terrace
- 3888 W Avenue One
- 352 Terri Dr
- 1675 Almador Terrace
- 76 Rancho Grande Cir
- 1943 Pollitt Ct
- 2068 Nebela Dr Unit 44
- 2068 Nebela Dr
- 2060 Nebela Dr Unit 42
- 2060 Nebela Dr
- 2073 Piro Dr
- 2077 Piro Dr
- 2069 Piro Dr
- 2072 Nebela Dr Unit 45
- 2072 Nebela Dr
- 2056 Nebela Dr Unit 41
- 2056 Nebela Dr
- 2081 Piro Dr
- 2065 Piro Dr
- 2065 Nebela Dr Unit 13
- 2065 Nebela Dr
- 2069 Nebela Dr Unit 14
- 2069 Nebela Dr
- 2076 Nebela Dr
- 2052 Nebela Dr Unit 40
- 2052 Nebela Dr