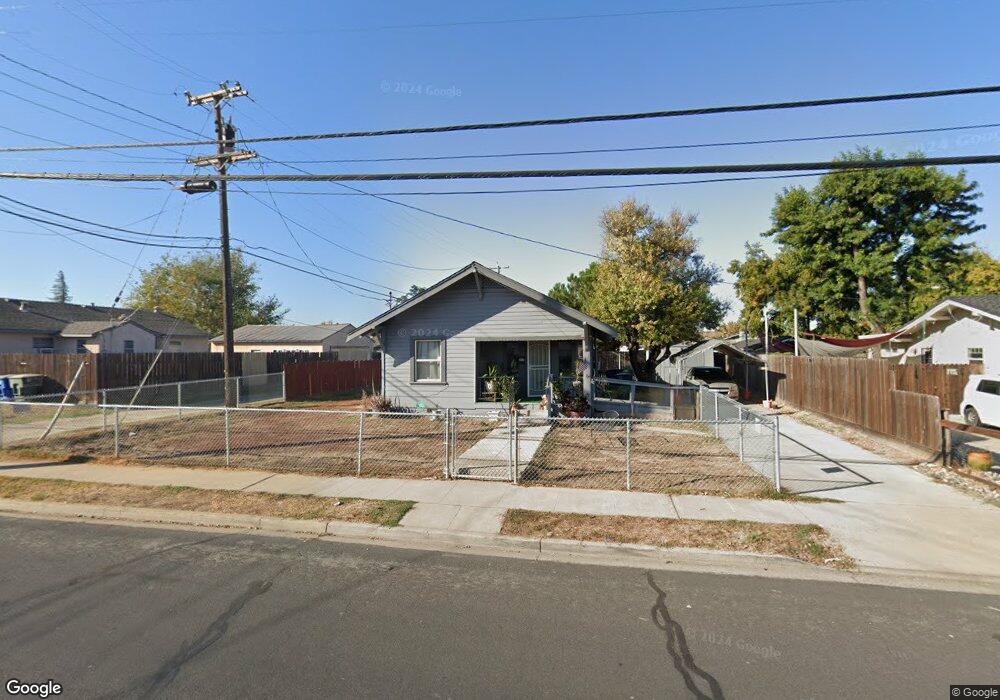
207 Locust Ave Manteca, CA 95337
Downtown Manteca NeighborhoodEstimated Value: $210,000 - $345,253
2
Beds
1
Bath
796
Sq Ft
$357/Sq Ft
Est. Value
About This Home
This home is located at 207 Locust Ave, Manteca, CA 95337 and is currently estimated at $284,063, approximately $356 per square foot. 207 Locust Ave is a home located in San Joaquin County with nearby schools including Sequoia Elementary School, Manteca High School, and St. Anthony's Catholic School.
Ownership History
Date
Name
Owned For
Owner Type
Purchase Details
Closed on
Jan 6, 2017
Sold by
Page Cathy and Tucker Kelley
Bought by
Page Cathy and Tucker Kelley
Current Estimated Value
Purchase Details
Closed on
Jan 29, 2015
Sold by
Page Kent L
Bought by
Page Kent L and Kent L Page Trust
Purchase Details
Closed on
Oct 1, 2010
Sold by
Page Glenn J and Page Lois R
Bought by
Page Kent L
Home Financials for this Owner
Home Financials are based on the most recent Mortgage that was taken out on this home.
Original Mortgage
$48,000
Interest Rate
4.28%
Mortgage Type
Seller Take Back
Purchase Details
Closed on
Mar 11, 1998
Sold by
Frisk Ervan and Chaney Helen Ruth
Bought by
Page Glenn and Page Lois
Home Financials for this Owner
Home Financials are based on the most recent Mortgage that was taken out on this home.
Original Mortgage
$45,500
Interest Rate
7.11%
Create a Home Valuation Report for This Property
The Home Valuation Report is an in-depth analysis detailing your home's value as well as a comparison with similar homes in the area
Home Values in the Area
Average Home Value in this Area
Purchase History
| Date | Buyer | Sale Price | Title Company |
|---|---|---|---|
| Page Cathy | -- | None Available | |
| Page Kent L | -- | None Available | |
| Page Kent L | $50,000 | Placer Title Company | |
| Page Glenn | $65,000 | Central Valley Title Company |
Source: Public Records
Mortgage History
| Date | Status | Borrower | Loan Amount |
|---|---|---|---|
| Previous Owner | Page Kent L | $48,000 | |
| Previous Owner | Page Glenn | $45,500 |
Source: Public Records
Tax History
| Year | Tax Paid | Tax Assessment Tax Assessment Total Assessment is a certain percentage of the fair market value that is determined by local assessors to be the total taxable value of land and additions on the property. | Land | Improvement |
|---|---|---|---|---|
| 2025 | $1,424 | $126,725 | $48,565 | $78,160 |
| 2024 | $1,384 | $124,241 | $47,613 | $76,628 |
| 2023 | $1,368 | $121,806 | $46,680 | $75,126 |
| 2022 | $1,347 | $119,418 | $45,765 | $73,653 |
| 2021 | $1,333 | $117,077 | $44,868 | $72,209 |
| 2020 | $1,279 | $115,877 | $44,408 | $71,469 |
| 2019 | $1,263 | $113,606 | $43,538 | $70,068 |
| 2018 | $1,246 | $111,380 | $42,685 | $68,695 |
| 2017 | $1,228 | $109,198 | $41,849 | $67,349 |
| 2016 | $614 | $54,112 | $27,056 | $27,056 |
| 2014 | $573 | $52,256 | $26,128 | $26,128 |
Source: Public Records
Map
Nearby Homes
- 119 Almond Ave
- 802 W Center St
- 1015 Tenaya Ct
- 865 Locust Ave
- 1164 Marion St
- 776 Folsom Way
- 1023 Camphor St
- 765 Jackolyn Dr
- 290 Victory Ave
- 414 Cherry Ln Unit G
- 578 Schooner Place
- 123 Wawona St
- 412 Golf Cir E Unit E
- 1432 Driftwood Way
- 707 Chenin Blanc Dr
- 896 Cinnamon Teal Ct
- 479 Cherry Ln Unit A
- 495 Cherry Ln Unit B
- 495 Cherry Ln Unit G
- 119 N Sherman Ave
Your Personal Tour Guide
Ask me questions while you tour the home.