2070 Erion Rd Batavia, OH 45103
Estimated Value: $449,000 - $646,451
4
Beds
4
Baths
3,058
Sq Ft
$184/Sq Ft
Est. Value
About This Home
This home is located at 2070 Erion Rd, Batavia, OH 45103 and is currently estimated at $562,113, approximately $183 per square foot. 2070 Erion Rd is a home with nearby schools including Batavia Elementary School, Batavia Middle School, and Batavia High School.
Ownership History
Date
Name
Owned For
Owner Type
Purchase Details
Closed on
Apr 28, 2018
Sold by
Campbell Scott
Bought by
Huber Jeffrey M and Huber Jessica K
Current Estimated Value
Home Financials for this Owner
Home Financials are based on the most recent Mortgage that was taken out on this home.
Original Mortgage
$40,000
Outstanding Balance
$34,481
Interest Rate
4.45%
Mortgage Type
New Conventional
Estimated Equity
$527,632
Purchase Details
Closed on
Jul 8, 2011
Sold by
Campbell Jody
Bought by
Campbell Scott
Purchase Details
Closed on
Jun 15, 2005
Sold by
Bbh Enterprise Group Llc
Bought by
Smith Lawrence C and Smith Davana Lynn
Purchase Details
Closed on
Jan 13, 2005
Sold by
Wolf Helmut and Wolf Mary Beth
Bought by
Bbh Enterprise Group Llc
Purchase Details
Closed on
May 13, 2004
Sold by
Countrytyme Lebanon Ltd
Bought by
Campbell Scott and Campbell Jody
Purchase Details
Closed on
Mar 11, 2004
Sold by
Galloway Land Co
Bought by
Countrytyme Lebanon Ltd
Create a Home Valuation Report for This Property
The Home Valuation Report is an in-depth analysis detailing your home's value as well as a comparison with similar homes in the area
Home Values in the Area
Average Home Value in this Area
Purchase History
| Date | Buyer | Sale Price | Title Company |
|---|---|---|---|
| Huber Jeffrey M | $50,000 | None Available | |
| Campbell Scott | -- | None Available | |
| Smith Lawrence C | -- | -- | |
| Bbh Enterprise Group Llc | -- | -- | |
| Campbell Scott | $45,000 | -- | |
| Countrytyme Lebanon Ltd | -- | -- | |
| Galloway Land Co | -- | -- |
Source: Public Records
Mortgage History
| Date | Status | Borrower | Loan Amount |
|---|---|---|---|
| Open | Huber Jeffrey M | $40,000 |
Source: Public Records
Tax History
| Year | Tax Paid | Tax Assessment Tax Assessment Total Assessment is a certain percentage of the fair market value that is determined by local assessors to be the total taxable value of land and additions on the property. | Land | Improvement |
|---|---|---|---|---|
| 2024 | $4,303 | $129,360 | $32,830 | $96,530 |
| 2023 | $4,536 | $119,460 | $24,150 | $95,310 |
| 2022 | $922 | $18,100 | $18,100 | $0 |
| 2021 | $930 | $18,100 | $18,100 | $0 |
| 2020 | $936 | $18,100 | $18,100 | $0 |
| 2019 | $961 | $17,430 | $17,430 | $0 |
| 2018 | $995 | $17,430 | $17,430 | $0 |
| 2017 | $870 | $17,430 | $17,430 | $0 |
| 2016 | $870 | $16,000 | $16,000 | $0 |
| 2015 | $827 | $16,000 | $16,000 | $0 |
| 2014 | $827 | $16,000 | $16,000 | $0 |
| 2013 | $780 | $14,700 | $14,700 | $0 |
Source: Public Records
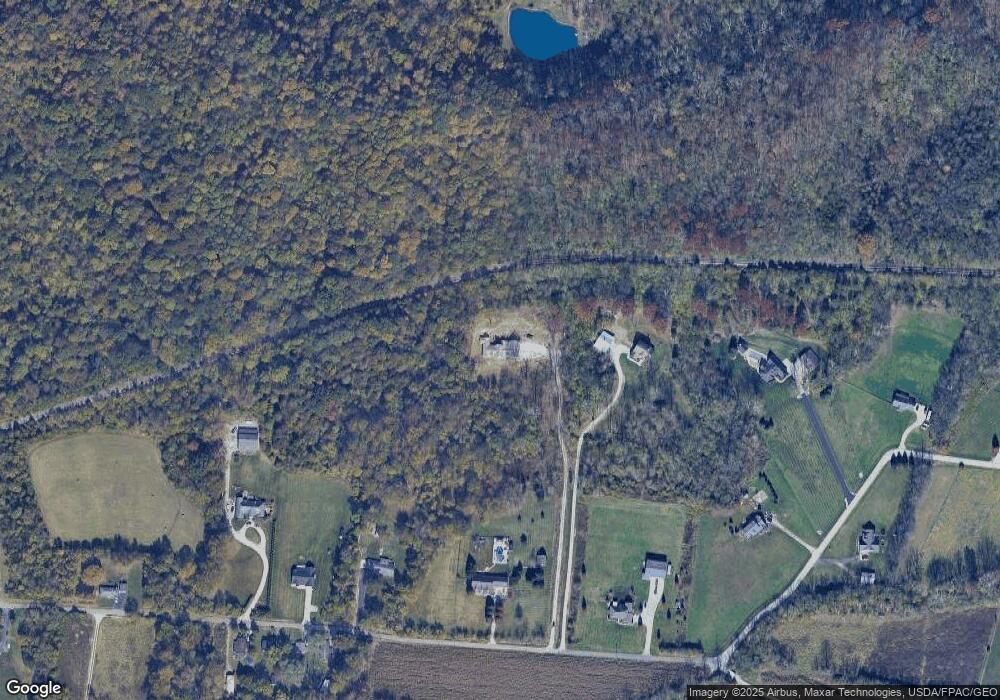
Map
Nearby Homes
- 393 Clark St
- 2280 Siesta Dr
- A Douglas Dr
- 1 Ely St
- 2124 Commons Cir
- 2021 Commons Cir Unit 2F
- 2115 Crossridge Dr
- 4333 Cordial Place
- 2140 Crossridge Dr
- 1323 Anacapa Ct
- 2188 Winemiller Ln
- 0 St Rt 132 Unit 1860682
- 625 College Dr
- 3 Old St Rt 32
- 3957 Ohio 132
- ac Summit Rd
- 6030 Filager Rd
- 4263 Fox Ridge Dr
- 2214 Trappers Knoll Dr
- 3807 Lucy Run Cemetery Rd
- 2080 Erion Rd
- 2060 Erion Rd
- 2040 Erion Rd
- 2050 Erion Rd
- 2090 Erion Rd
- 4025 Blue Ridge Rd
- 2030 Erion Rd
- 4 Erion Rd
- 2012 Erion Rd
- 4035 Blue Ridge Dr
- 4035 Blue Ridge Dr
- 2010 Erion Rd
- 2008 Erion Rd
- 4045 Blue Ridge Rd
- 4030 Blue Ridge Rd
- 2006 Erion Rd
- 103 Alexas Way
- 1672 St Rt 125
- 4038 Hill Top Ln
- 1986 Erion Rd
Your Personal Tour Guide
Ask me questions while you tour the home.