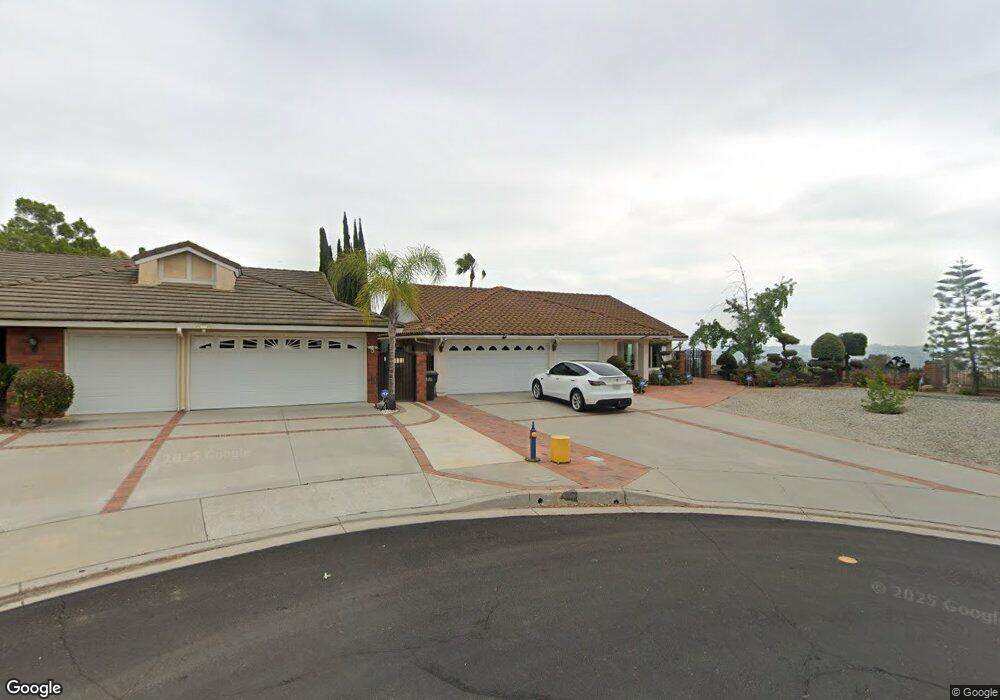
20856 E Yellow Feather Cir Walnut, CA 91789
Estimated Value: $1,332,000 - $1,537,000
4
Beds
2
Baths
2,053
Sq Ft
$696/Sq Ft
Est. Value
About This Home
This home is located at 20856 E Yellow Feather Cir, Walnut, CA 91789 and is currently estimated at $1,429,268, approximately $696 per square foot. 20856 E Yellow Feather Cir is a home located in Los Angeles County with nearby schools including Leonard G. Westhoff Elementary School, Suzanne Middle School, and Walnut High School.
Ownership History
Date
Name
Owned For
Owner Type
Purchase Details
Closed on
Jul 3, 2009
Sold by
Trinh Nam S
Bought by
Trinh Nam S and Song Bei
Current Estimated Value
Home Financials for this Owner
Home Financials are based on the most recent Mortgage that was taken out on this home.
Original Mortgage
$268,500
Outstanding Balance
$170,460
Interest Rate
4.78%
Mortgage Type
New Conventional
Estimated Equity
$1,258,808
Purchase Details
Closed on
May 20, 2002
Sold by
Tran Julie L
Bought by
Trinh Nam S
Purchase Details
Closed on
Aug 2, 2001
Sold by
Yu Michael Anmin and Yu Joy H
Bought by
Trinh Nam S and Tran Julie L
Home Financials for this Owner
Home Financials are based on the most recent Mortgage that was taken out on this home.
Original Mortgage
$340,000
Interest Rate
7.05%
Create a Home Valuation Report for This Property
The Home Valuation Report is an in-depth analysis detailing your home's value as well as a comparison with similar homes in the area
Home Values in the Area
Average Home Value in this Area
Purchase History
| Date | Buyer | Sale Price | Title Company |
|---|---|---|---|
| Trinh Nam S | -- | Accommodation | |
| Trinh Nam S | -- | -- | |
| Trinh Nam S | $425,000 | Ticor Title Insurance |
Source: Public Records
Mortgage History
| Date | Status | Borrower | Loan Amount |
|---|---|---|---|
| Open | Trinh Nam S | $268,500 | |
| Previous Owner | Trinh Nam S | $340,000 |
Source: Public Records
Tax History
| Year | Tax Paid | Tax Assessment Tax Assessment Total Assessment is a certain percentage of the fair market value that is determined by local assessors to be the total taxable value of land and additions on the property. | Land | Improvement |
|---|---|---|---|---|
| 2025 | $8,867 | $679,797 | $416,514 | $263,283 |
| 2024 | $8,867 | $666,469 | $408,348 | $258,121 |
| 2023 | $8,616 | $653,402 | $400,342 | $253,060 |
| 2022 | $8,399 | $640,592 | $392,493 | $248,099 |
| 2021 | $8,248 | $628,033 | $384,798 | $243,235 |
| 2019 | $8,003 | $609,407 | $373,386 | $236,021 |
| 2018 | $7,540 | $597,459 | $366,065 | $231,394 |
| 2016 | $7,008 | $574,260 | $351,851 | $222,409 |
| 2015 | $7,047 | $565,635 | $346,566 | $219,069 |
| 2014 | $7,074 | $554,556 | $339,778 | $214,778 |
Source: Public Records
Map
Nearby Homes
- 931 Sky Meadow Place
- 1359 Point Loma Place
- 1371 Point Loma Place
- 805 Silver Valley Trail
- 973 Ichabod Way
- 1025 N Horseshoe Bend
- 16 Camelback
- 15 Camelback Dr
- 20672 Buckland Dr
- 1668 Chestnut Hill Dr
- 21029 Stoddard Wells Rd
- 21529 Magnolia St
- 21530 Magnolia St
- 792 El Vallencito Dr
- 19933 Hidden Springs Rd
- 19852 Moon Shadow Cir
- 351 Spur Trail Ave
- 21819 E Chestnut Ct
- 20033 E Skyline Dr
- 22046 Florence Cir
- 20859 E Yellow Feather Cir
- 20855 E Yellow Feather Cir
- 20840 E Yellow Feather Cir
- 20851 E Yellow Feather Cir
- 20832 E Yellow Feather Cir
- 1120 Sunset Bluff Rd
- 1128 Sunset Bluff Rd
- 20824 E Yellow Feather Cir
- 1134 Sunset Bluff Rd
- 1114 Sunset Bluff Rd
- 20818 E Yellow Feather Cir
- 1142 Sunset Bluff Rd
- 20823 E Yellow Feather Cir
- 1125 Sunset Bluff Rd
- 1103 Sunset Bluff Rd
- 1115 Sunset Bluff Rd
- 1141 Sunset Bluff Rd
- 1077 Regal Canyon Dr
- 1073 Regal Canyon Dr
- 20810 E Yellow Feather Cir
Your Personal Tour Guide
Ask me questions while you tour the home.