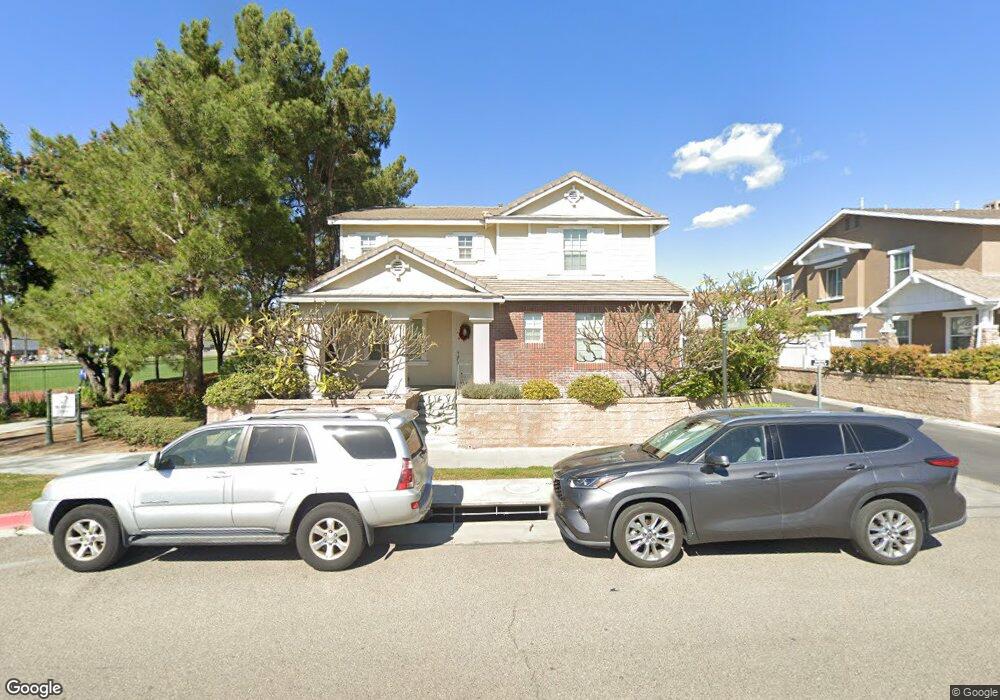
2093 Hetebrink St Fullerton, CA 92833
Sunny Hills NeighborhoodEstimated Value: $1,805,461 - $1,900,000
3
Beds
3
Baths
3,182
Sq Ft
$584/Sq Ft
Est. Value
About This Home
This home is located at 2093 Hetebrink St, Fullerton, CA 92833 and is currently estimated at $1,857,615, approximately $583 per square foot. 2093 Hetebrink St is a home located in Orange County with nearby schools including Robert C. Fisler Elementary School, Sunny Hills High School, and Arborland Montessori - Hughes Dr. Campus.
Ownership History
Date
Name
Owned For
Owner Type
Purchase Details
Closed on
Oct 24, 2003
Sold by
Lee Woong Bae
Bought by
Lee Johanna
Current Estimated Value
Home Financials for this Owner
Home Financials are based on the most recent Mortgage that was taken out on this home.
Original Mortgage
$322,700
Interest Rate
4.87%
Mortgage Type
Purchase Money Mortgage
Purchase Details
Closed on
Sep 17, 2003
Sold by
Kb Home Coastal Inc
Bought by
Lee Johanna
Home Financials for this Owner
Home Financials are based on the most recent Mortgage that was taken out on this home.
Original Mortgage
$322,700
Interest Rate
4.87%
Mortgage Type
Purchase Money Mortgage
Purchase Details
Closed on
Jul 24, 2003
Sold by
Kb Home Coastal Inc
Bought by
Yi James Sang Ho and Yi Myung Sook
Home Financials for this Owner
Home Financials are based on the most recent Mortgage that was taken out on this home.
Original Mortgage
$322,700
Interest Rate
4.87%
Mortgage Type
Purchase Money Mortgage
Create a Home Valuation Report for This Property
The Home Valuation Report is an in-depth analysis detailing your home's value as well as a comparison with similar homes in the area
Home Values in the Area
Average Home Value in this Area
Purchase History
| Date | Buyer | Sale Price | Title Company |
|---|---|---|---|
| Lee Johanna | -- | First American Title Ins Co | |
| Lee Johanna | $658,000 | First American Title Co | |
| Yi James Sang Ho | $600,000 | First American Title Company |
Source: Public Records
Mortgage History
| Date | Status | Borrower | Loan Amount |
|---|---|---|---|
| Previous Owner | Lee Johanna | $322,700 | |
| Previous Owner | Yi James Sang Ho | $419,000 |
Source: Public Records
Tax History Compared to Growth
Tax History
| Year | Tax Paid | Tax Assessment Tax Assessment Total Assessment is a certain percentage of the fair market value that is determined by local assessors to be the total taxable value of land and additions on the property. | Land | Improvement |
|---|---|---|---|---|
| 2025 | $13,025 | $935,148 | $462,956 | $472,192 |
| 2024 | $13,025 | $916,812 | $453,878 | $462,934 |
| 2023 | $12,752 | $898,836 | $444,979 | $453,857 |
| 2022 | $12,683 | $881,212 | $436,254 | $444,958 |
| 2021 | $13,159 | $863,934 | $427,700 | $436,234 |
| 2020 | $13,049 | $855,076 | $423,315 | $431,761 |
| 2019 | $12,768 | $838,310 | $415,014 | $423,296 |
| 2018 | $12,605 | $821,873 | $406,876 | $414,997 |
| 2017 | $12,420 | $805,758 | $398,898 | $406,860 |
| 2016 | $12,207 | $789,959 | $391,076 | $398,883 |
| 2015 | $11,927 | $778,094 | $385,202 | $392,892 |
| 2014 | $11,650 | $762,853 | $377,657 | $385,196 |
Source: Public Records
Map
Nearby Homes
- 2006 Hetebrink St
- 1180 Cornwell Dr
- 2268 Simon St
- 2245 Chaffee St
- 433 435 N Basque
- 2038 Redfield St
- 1108 Jewett Dr Unit 23
- 1130 Whitewater Dr Unit 263
- 1123 Klose Ln
- 1340 Walraven Ct
- 1022 Creekside Dr Unit 198
- 1655 Valley Ln
- 1716 Celeste Ln
- 1615 Via Linda Unit 16
- 2517 Greenhill Dr
- 830 Delphine Place
- 2132 Calavera Place
- 1400 Post Rd
- 2307 Camino Recondito
- 1800 Yermo Place
- 2089 Hetebrink St
- 2081 Hetebrink St
- 2088 Ward St
- 2094 Ward St
- 2082 Ward St
- 2075 Hetebrink St
- 2090 Hetebrink St
- 2076 Ward St
- 2080 Hetebrink St
- 2067 Hetebrink St
- 2070 Ward St
- 2070 Hetebrink St
- 2065 Hetebrink St
- 2138 Hetebrink St
- 2066 Ward St
- 2091 Hessen St
- 1334 Verry St
- 2066 Hetebrink St
- 2081 Hessen St
- 2061 Hetebrink St