2120 E 25th Place Lawrence, KS 66046
Estimated Value: $349,000 - $367,922
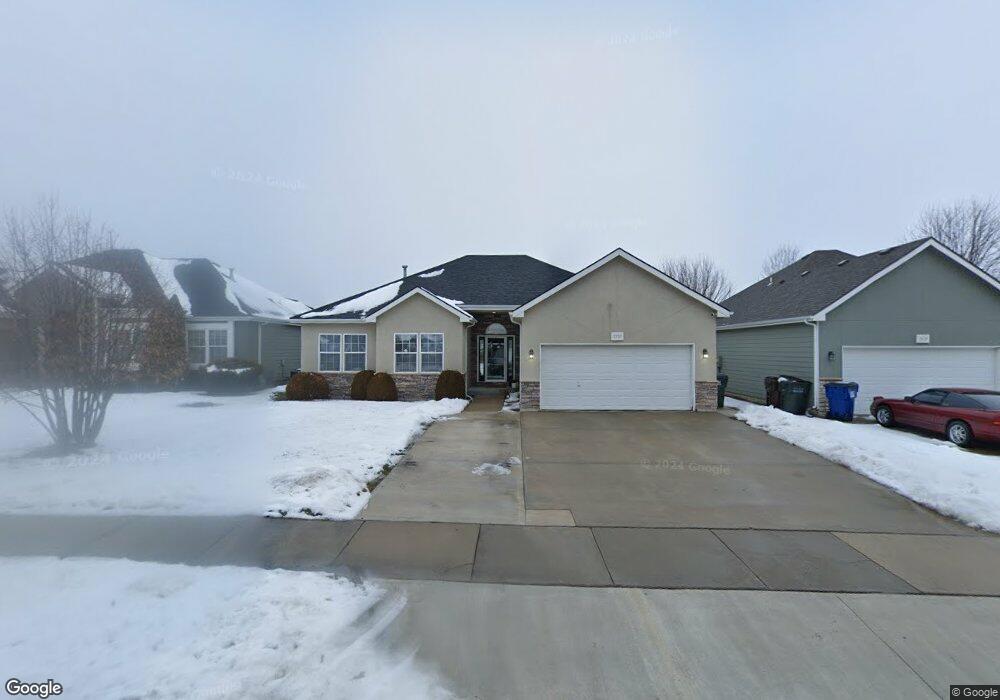
About This Home
This home is located at 2120 E 25th Place, Lawrence, KS 66046 and is currently estimated at $358,981, approximately $231 per square foot. 2120 E 25th Place is a home located in Douglas County with nearby schools including Prairie Park Elementary School, Billy Mills Middle School, and Lawrence High School.
Ownership History
We collect this data history from publicly available records. To have your information removed, we recommend requesting removal directly through your county’s website.
Purchase Details
Purchase Details
Home Financials for this Owner
Home Financials are based on the most recent Mortgage that was taken out on this home.Purchase Details
Home Financials for this Owner
Home Financials are based on the most recent Mortgage that was taken out on this home.Purchase History
We collect this data history from publicly available records. To have your information removed, we recommend requesting removal directly through your county’s website.
| Date | Buyer | Sale Price | Title Company |
|---|---|---|---|
| -- | Servicelink | ||
| -- | Capital Title Ins Company Lc | ||
| -- | Commerce Title |
Mortgage History
We collect this data history from publicly available records. To have your information removed, we recommend requesting removal directly through your county’s website.
| Date | Status | Borrower | Loan Amount |
|---|---|---|---|
| Open | $196,256 | ||
| Previous Owner | $159,920 |
Tax History
We collect this data history from publicly available records. To have your information removed, we recommend requesting removal directly through your county’s website.
| Year | Tax Paid | Tax Assessment Tax Assessment Total Assessment is a certain percentage of the fair market value that is determined by local assessors to be the total taxable value of land and additions on the property. | Land | Improvement |
|---|---|---|---|---|
| 2025 | $5,098 | $41,101 | $8,050 | $33,051 |
| 2024 | $4,998 | $40,296 | $7,475 | $32,821 |
| 2023 | $4,706 | $36,628 | $6,900 | $29,728 |
| 2022 | $4,298 | $33,258 | $6,325 | $26,933 |
| 2021 | $3,791 | $28,415 | $5,175 | $23,240 |
| 2020 | $3,556 | $26,807 | $5,175 | $21,632 |
| 2019 | $3,381 | $25,530 | $4,947 | $20,583 |
| 2018 | $3,169 | $23,777 | $4,720 | $19,057 |
| 2017 | $3,000 | $22,276 | $4,720 | $17,556 |
| 2016 | $2,796 | $21,701 | $4,600 | $17,101 |
| 2015 | $2,980 | $23,104 | $7,360 | $15,744 |
| 2014 | $3,030 | $23,713 | $7,360 | $16,353 |
Map
- 2429 Surrey Dr
- 2621 Bishop St
- 2717 Fenwick Rd
- 2512 Marcia Ln
- 2529 E 26th Terrace
- 2531 Arlene Place
- 2533 Arlene Place
- 2529 Arlene Place
- 2705 Chasehire Dr
- 2530 Arlene Place
- 2601 Harper St
- 2625 Bridgewater Dr
- 2624 E 26th Ct
- 2533 Bonanza St
- 1414 E 25th Terrace
- 1713 E 21st Terrace
- 1708 E 21st Terrace
- 1200 E 25th Terrace
- 1919 Clare Rd
- 1508 E 18th Terrace
- 2128 E 25th Place
- 2112 E 25th Place
- 2121 E 25th Ct
- 2115 E 25th Ct
- 2136 E 25th Place
- 2113 E 25th Ct
- 2104 E 25th Place
- 2123 E 25th Ct
- 2107 E 25th Ct
- 2125 E 25th Place
- 2117 E 25th Place
- 2105 E 25th Ct
- 2133 E 25th Place
- 2144 E 25th Place
- 2109 E 25th Place
- 2130 E 25th Ct
- 2141 E 25th Place
- 2101 E 25th Place
- 2128 E 25th Ct
- 2152 E 25th Place
Ask me questions while you tour the home.