Estimated Value: $326,000 - $330,189
3
Beds
2
Baths
1,335
Sq Ft
$246/Sq Ft
Est. Value
About This Home
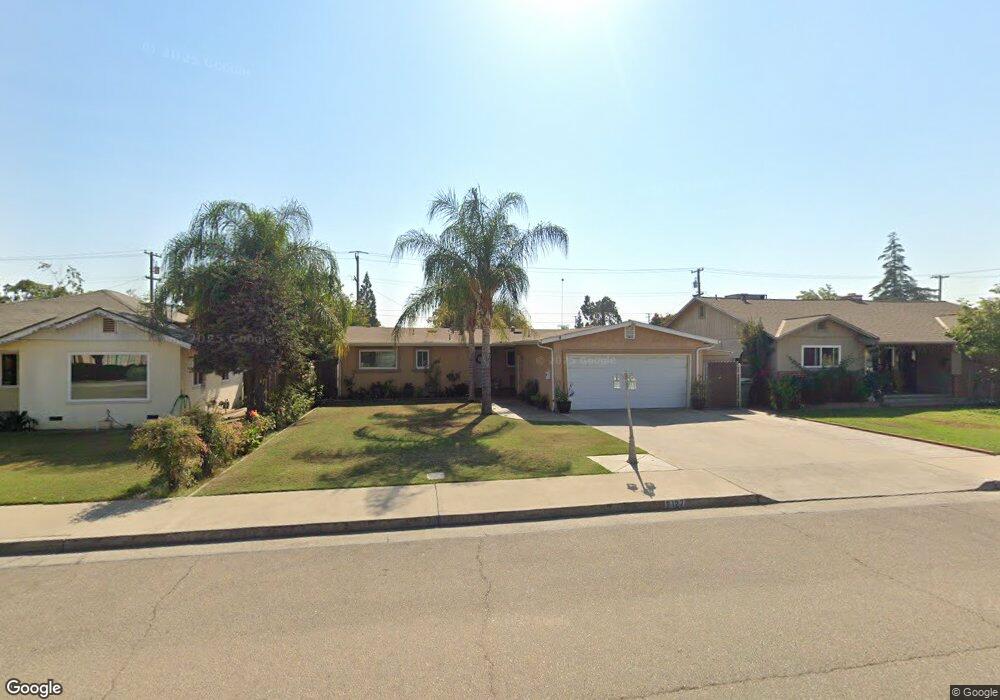
This home is located at 2127 Maple St, Selma, CA 93662 and is currently estimated at $328,730, approximately $246 per square foot. 2127 Maple St is a home located in Fresno County with nearby schools including Theodore Roosevelt Elementary School, Abraham Lincoln Middle School, and Selma High School.
Ownership History
Date
Name
Owned For
Owner Type
Purchase Details
Closed on
Oct 21, 2003
Sold by
Hernandez Magdalena
Bought by
Hernandez Frank
Current Estimated Value
Purchase Details
Closed on
Jan 8, 1999
Sold by
Loutherback Evelyn A
Bought by
Loutherback Robert O
Home Financials for this Owner
Home Financials are based on the most recent Mortgage that was taken out on this home.
Original Mortgage
$77,492
Interest Rate
6.63%
Mortgage Type
FHA
Purchase Details
Closed on
Dec 3, 1998
Sold by
Loutherback Robert O
Bought by
Hernandez Frank and Hernandez Magdalena
Home Financials for this Owner
Home Financials are based on the most recent Mortgage that was taken out on this home.
Original Mortgage
$77,492
Interest Rate
6.63%
Mortgage Type
FHA
Create a Home Valuation Report for This Property
The Home Valuation Report is an in-depth analysis detailing your home's value as well as a comparison with similar homes in the area
Home Values in the Area
Average Home Value in this Area
Purchase History
| Date | Buyer | Sale Price | Title Company |
|---|---|---|---|
| Hernandez Frank | -- | Chicago Title Company | |
| Loutherback Robert O | -- | Central Title Company | |
| Hernandez Frank | $78,000 | Central Title Company |
Source: Public Records
Mortgage History
| Date | Status | Borrower | Loan Amount |
|---|---|---|---|
| Previous Owner | Hernandez Frank | $77,492 | |
| Closed | Hernandez Frank | $2,332 |
Source: Public Records
Tax History
| Year | Tax Paid | Tax Assessment Tax Assessment Total Assessment is a certain percentage of the fair market value that is determined by local assessors to be the total taxable value of land and additions on the property. | Land | Improvement |
|---|---|---|---|---|
| 2025 | $2,381 | $122,254 | $47,019 | $75,235 |
| 2023 | $1,855 | $117,509 | $45,195 | $72,314 |
| 2022 | $2,187 | $115,206 | $44,309 | $70,897 |
| 2021 | $2,130 | $112,948 | $43,441 | $69,507 |
| 2020 | $2,099 | $111,791 | $42,996 | $68,795 |
| 2019 | $2,036 | $109,600 | $42,153 | $67,447 |
| 2018 | $1,985 | $107,452 | $41,327 | $66,125 |
| 2017 | $1,906 | $105,346 | $40,517 | $64,829 |
| 2016 | $1,729 | $103,281 | $39,723 | $63,558 |
| 2015 | $1,749 | $101,731 | $39,127 | $62,604 |
| 2014 | $1,695 | $99,739 | $38,361 | $61,378 |
Source: Public Records
Map
Nearby Homes
- 2221 Floral Ave
- 2222 Barbara St
- 3239 Lee St
- 2766 Lee St
- 12623 S Mccall Ave
- 2002 Merced St
- 1607 Cooper St
- 3280 Mccall Ave
- 2629 Mccall Ave
- 2126 Tulare St
- 2226 Arrants St
- 2753 Thompson Ave
- 2980 Olive St
- 1517 Stillman St
- 2510 Whitson St
- 1340 Lewis St
- 2580 Jackson St
- 1405 Huntsman Ave
- 2561 Stillman St Unit 111
- 0 Rose Ave
Your Personal Tour Guide
Ask me questions while you tour the home.