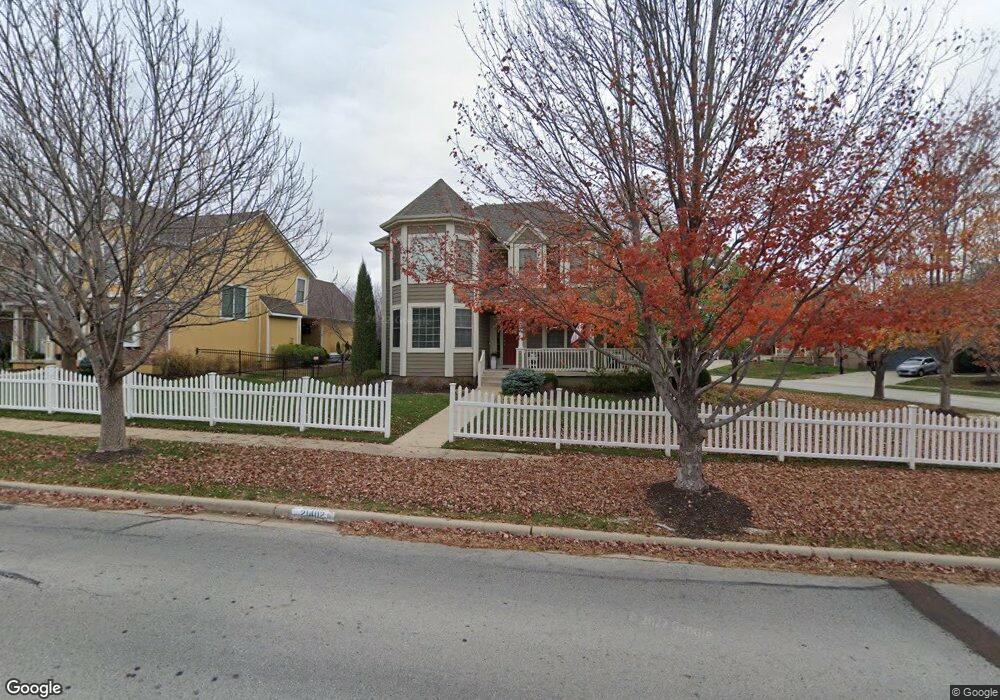
21402 Clear Creek Pkwy Shawnee, KS 66218
Estimated Value: $448,000 - $496,000
3
Beds
4
Baths
2,340
Sq Ft
$204/Sq Ft
Est. Value
About This Home
This home is located at 21402 Clear Creek Pkwy, Shawnee, KS 66218 and is currently estimated at $478,285, approximately $204 per square foot. 21402 Clear Creek Pkwy is a home located in Johnson County with nearby schools including Clear Creek Elementary School, Monticello Trails Middle School, and Mill Valley High School.
Ownership History
Date
Name
Owned For
Owner Type
Purchase Details
Closed on
Sep 23, 2009
Sold by
Grant Steven E and Grant Patricia Lynn
Bought by
Davis Melissa L
Current Estimated Value
Home Financials for this Owner
Home Financials are based on the most recent Mortgage that was taken out on this home.
Original Mortgage
$33,750
Interest Rate
4.77%
Mortgage Type
Stand Alone Second
Purchase Details
Closed on
Sep 23, 2005
Sold by
B L Rieks & Assn Inc
Bought by
Grant Steven E and Grant Patricia Lynn
Purchase Details
Closed on
Nov 23, 2003
Sold by
S C C Investors Llc
Bought by
B L Rieke & Associates Inc
Home Financials for this Owner
Home Financials are based on the most recent Mortgage that was taken out on this home.
Original Mortgage
$1,143,000
Interest Rate
5.97%
Mortgage Type
Purchase Money Mortgage
Create a Home Valuation Report for This Property
The Home Valuation Report is an in-depth analysis detailing your home's value as well as a comparison with similar homes in the area
Home Values in the Area
Average Home Value in this Area
Purchase History
| Date | Buyer | Sale Price | Title Company |
|---|---|---|---|
| Davis Melissa L | -- | Continental Title Company | |
| Grant Steven E | -- | First American Title Insuran | |
| B L Rieke & Associates Inc | -- | Security Land Title Company |
Source: Public Records
Mortgage History
| Date | Status | Borrower | Loan Amount |
|---|---|---|---|
| Closed | Davis Melissa L | $33,750 | |
| Open | Davis Melissa L | $180,000 | |
| Previous Owner | B L Rieke & Associates Inc | $1,143,000 |
Source: Public Records
Tax History Compared to Growth
Tax History
| Year | Tax Paid | Tax Assessment Tax Assessment Total Assessment is a certain percentage of the fair market value that is determined by local assessors to be the total taxable value of land and additions on the property. | Land | Improvement |
|---|---|---|---|---|
| 2024 | $5,766 | $49,565 | $10,586 | $38,979 |
| 2023 | $5,432 | $46,196 | $10,586 | $35,610 |
| 2022 | $5,123 | $42,688 | $9,621 | $33,067 |
| 2021 | $4,772 | $38,215 | $8,745 | $29,470 |
| 2020 | $4,378 | $34,730 | $8,745 | $25,985 |
| 2019 | $4,372 | $34,178 | $7,605 | $26,573 |
| 2018 | $4,033 | $31,234 | $7,605 | $23,629 |
| 2017 | $4,055 | $30,648 | $6,615 | $24,033 |
| 2016 | $3,973 | $29,659 | $6,301 | $23,358 |
| 2015 | $3,854 | $28,290 | $6,301 | $21,989 |
| 2013 | -- | $26,002 | $6,301 | $19,701 |
Source: Public Records
Map
Nearby Homes
- 5900 Redbud St
- 6031 Lakecrest Dr
- 5725 Marion St
- 21315 W 56th St
- 21309 W 56th St
- 6046 Redbud St
- 21217 W 55th Terrace
- 21609 W 61st St
- 5817 Millbrook St
- 22209 W 57th St
- 5405 Lakecrest Dr
- 21624 W 53rd Terrace
- 22310 W 58th St
- 5307 Noble St
- 5311 Brownridge Dr
- 6246 Woodland Dr
- 5531 Hilltop Dr
- 5402 Roundtree St
- 24621 W 60th St
- 22605 W 56th St
- 21406 Clear Creek Pkwy
- 21410 Clear Creek Pkwy
- 21314 W 59th St
- 21310 W 59th St
- 5905 Lone Elm Rd
- 21322 W 59th St
- 21318 W 59th St
- 21414 Clear Creek Pkwy
- 21306 W 59th Terrace
- 21310 W 59th Terrace
- 21408 W 59th St
- 5915 Lone Elm Rd
- 21230 W 59th Terrace
- 21326 W 59th St
- 5832 Lakecrest Dr
- 5836 Lakecrest Dr
- 21418 Clear Creek Pkwy
- 21226 W 59th Terrace
- 5921 Lone Elm Rd
- 21412 W 59th St