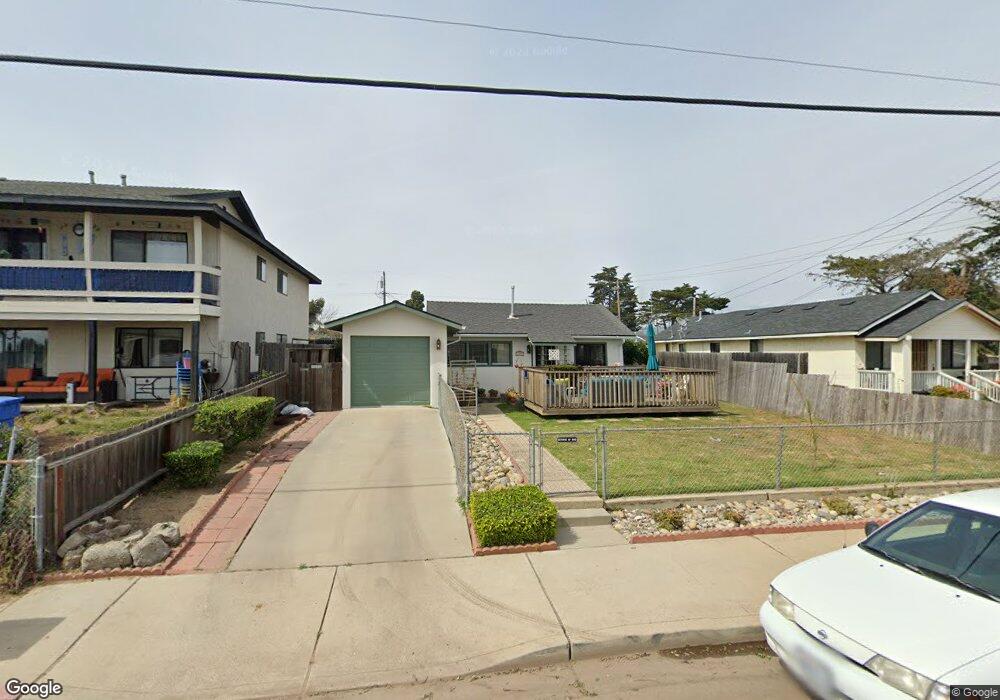
2181 Paso Robles St Oceano, CA 93445
Oceano NeighborhoodEstimated Value: $523,807 - $622,000
2
Beds
1
Bath
774
Sq Ft
$742/Sq Ft
Est. Value
About This Home
This home is located at 2181 Paso Robles St, Oceano, CA 93445 and is currently estimated at $574,202, approximately $741 per square foot. 2181 Paso Robles St is a home located in San Luis Obispo County with nearby schools including Oceano Elementary School, Judkins Middle School, and Arroyo Grande High School.
Ownership History
Date
Name
Owned For
Owner Type
Purchase Details
Closed on
Jun 25, 2018
Sold by
Cabusas Sean
Bought by
Cabusas Christine D
Current Estimated Value
Purchase Details
Closed on
Dec 15, 2017
Sold by
Marquez Theresa and Carney Helen Lorraine
Bought by
Marquez Theresa
Purchase Details
Closed on
Nov 18, 2009
Sold by
Carney Helen
Bought by
Marquez Theresa I and Marquez Stephen A
Purchase Details
Closed on
May 19, 2009
Sold by
Carney Helen
Bought by
Marquez Stephen A and Marquez Michelle R
Purchase Details
Closed on
Jun 11, 2007
Sold by
Carney Helen
Bought by
Marquez Theresa I and Marquez Stephen A
Purchase Details
Closed on
Nov 17, 1998
Sold by
Baltierra Irene M
Bought by
Carney Helen
Create a Home Valuation Report for This Property
The Home Valuation Report is an in-depth analysis detailing your home's value as well as a comparison with similar homes in the area
Home Values in the Area
Average Home Value in this Area
Purchase History
| Date | Buyer | Sale Price | Title Company |
|---|---|---|---|
| Cabusas Christine D | -- | First American Title Co | |
| Marquez Michelle Rose | $40,000 | First American Title Co | |
| Marquez Stephen A | -- | First American Title Co | |
| Marquez Theresa | -- | None Available | |
| Marquez Theresa I | -- | None Available | |
| Marquez Stephen A | -- | None Available | |
| Marquez Theresa I | -- | None Available | |
| Carney Helen | -- | -- |
Source: Public Records
Tax History Compared to Growth
Tax History
| Year | Tax Paid | Tax Assessment Tax Assessment Total Assessment is a certain percentage of the fair market value that is determined by local assessors to be the total taxable value of land and additions on the property. | Land | Improvement |
|---|---|---|---|---|
| 2025 | $1,801 | $144,348 | $69,511 | $74,837 |
| 2024 | $1,784 | $141,519 | $68,149 | $73,370 |
| 2023 | $1,784 | $138,745 | $66,813 | $71,932 |
| 2022 | $1,762 | $136,025 | $65,503 | $70,522 |
| 2021 | $1,759 | $133,359 | $64,219 | $69,140 |
| 2020 | $1,742 | $131,993 | $63,561 | $68,432 |
| 2019 | $1,732 | $129,406 | $62,315 | $67,091 |
| 2018 | $764 | $43,267 | $5,857 | $37,410 |
| 2017 | $655 | $42,420 | $5,743 | $36,677 |
| 2016 | $608 | $41,589 | $5,631 | $35,958 |
| 2015 | $365 | $40,965 | $5,547 | $35,418 |
| 2014 | $350 | $40,164 | $5,439 | $34,725 |
Source: Public Records
Map
Nearby Homes
- 1700 22nd St
- 2201 La Verne St
- 2130 Ocean St
- 2120 Ocean St
- 1659 Paso Robles St
- 1681 Ocean St
- 1555 Nabal Ct
- 1449 Ronald Way
- 1515 Nabal Ct
- 1610 16th St
- 2300 Cienaga St Unit 55
- 1490 16th St
- 1515 Ocean St
- 2531 Cienaga St Unit 3
- 2400 Cienaga St Unit 65
- 155 Lynne St
- 42 Cienaga St
- 1154 Marseille Ct
- 2700 Cienaga St Unit 8
- 1207 Capitola St
- 2191 Paso Robles St
- 1650 22nd St
- 2145 Paso Robles St
- 2221 Paso Robles St
- 1620 22nd St
- 2143 Paso Robles St
- 2143 Paso Robles St Unit A-F
- 2215 Paso Robles St Unit 2
- 2215 Paso Robles St Unit 1
- 2180 Paso Robles St
- 2170 Warner St
- 2168 Paso Robles St
- 1651 22nd St
- 2160 Warner St
- 1600 22nd St
- 2160 Paso Robles St
- 2150 Paso Robles St
- 2210 Paso Robles St
- 2152 Warner St