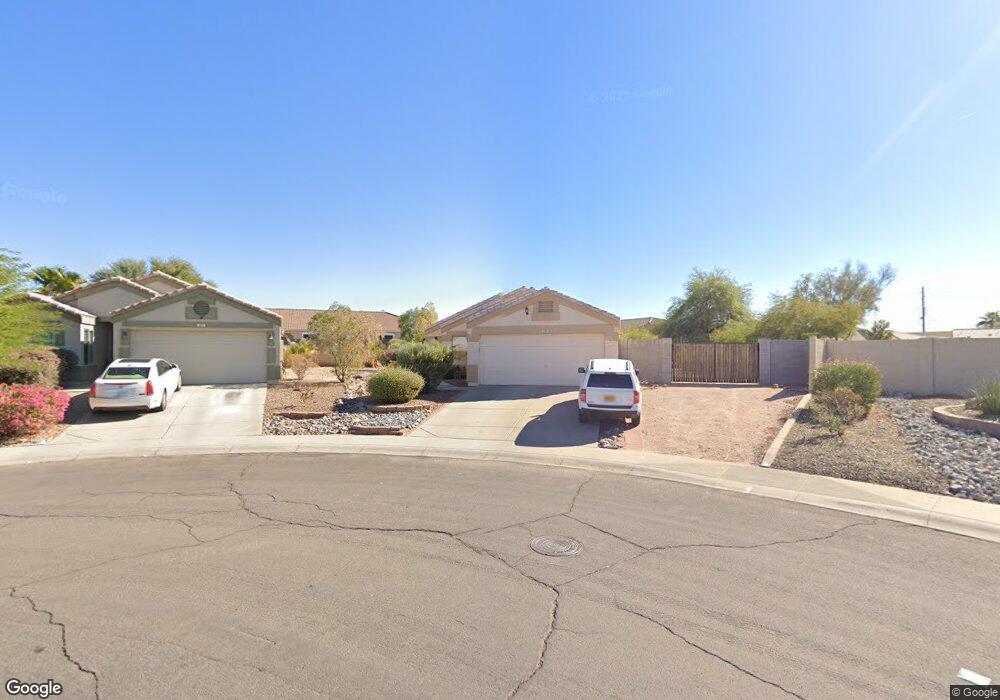
2199 S Weaver Dr Apache Junction, AZ 85120
Estimated Value: $348,000 - $375,767
3
Beds
2
Baths
1,264
Sq Ft
$285/Sq Ft
Est. Value
About This Home
This home is located at 2199 S Weaver Dr, Apache Junction, AZ 85120 and is currently estimated at $360,692, approximately $285 per square foot. 2199 S Weaver Dr is a home located in Pinal County with nearby schools including Desert Vista Elementary School, Cactus Canyon Junior High School, and Apache Junction High School.
Ownership History
Date
Name
Owned For
Owner Type
Purchase Details
Closed on
Jan 16, 2024
Sold by
David And Shirley Johnsrud Living Trust
Bought by
Johnsrud David A
Current Estimated Value
Purchase Details
Closed on
Mar 22, 2013
Sold by
Johnsrud David A and Johnsrud Shirley M
Bought by
Johnsrud David A and Johnsrud Shirley M
Purchase Details
Closed on
Feb 3, 2011
Sold by
Wells Fargo Bank Na
Bought by
Johnsrud David A and Johnsrud Shirley M
Purchase Details
Closed on
Nov 22, 2010
Sold by
Bartolome John F
Bought by
Wells Fargo Bank Na
Purchase Details
Closed on
Mar 8, 2000
Sold by
Diamond Key Homes Inc
Bought by
Bartolome John F
Home Financials for this Owner
Home Financials are based on the most recent Mortgage that was taken out on this home.
Original Mortgage
$106,595
Interest Rate
8.27%
Mortgage Type
FHA
Create a Home Valuation Report for This Property
The Home Valuation Report is an in-depth analysis detailing your home's value as well as a comparison with similar homes in the area
Home Values in the Area
Average Home Value in this Area
Purchase History
| Date | Buyer | Sale Price | Title Company |
|---|---|---|---|
| Johnsrud David A | -- | None Listed On Document | |
| Johnsrud David A | -- | None Available | |
| Johnsrud David A | $75,900 | Fidelity Natl Title Ins Co | |
| Wells Fargo Bank Na | $62,998 | Lsi Title | |
| Bartolome John F | $108,165 | -- |
Source: Public Records
Mortgage History
| Date | Status | Borrower | Loan Amount |
|---|---|---|---|
| Previous Owner | Bartolome John F | $106,595 |
Source: Public Records
Tax History
| Year | Tax Paid | Tax Assessment Tax Assessment Total Assessment is a certain percentage of the fair market value that is determined by local assessors to be the total taxable value of land and additions on the property. | Land | Improvement |
|---|---|---|---|---|
| 2025 | $1,535 | $35,835 | -- | -- |
| 2024 | $1,513 | $37,387 | -- | -- |
| 2023 | $1,513 | $25,722 | $5,950 | $19,772 |
| 2022 | $1,453 | $20,436 | $5,950 | $14,486 |
| 2021 | $1,475 | $18,770 | $0 | $0 |
| 2020 | $1,438 | $18,172 | $0 | $0 |
| 2019 | $1,414 | $17,442 | $0 | $0 |
| 2018 | $1,385 | $11,452 | $0 | $0 |
| 2017 | $1,372 | $10,835 | $0 | $0 |
| 2016 | $1,352 | $10,803 | $1,100 | $9,703 |
| 2014 | $1,141 | $6,907 | $1,100 | $5,807 |
Source: Public Records
Map
Nearby Homes
- 690 W 23rd Ave
- 1240 W Diamond Ave
- 3289 W Spaulding Ave
- 677 W 22nd Ave
- 1294 W Mesquite Ave
- 1844 S Monterey Dr
- 1428 W Mesquite Ave
- 762 W 17th Ave
- 1840 S Pinto Dr
- 2037 S Saguaro Dr
- 230 W 22nd Ave
- 2137 W Erie Ave Unit 137
- 2126 S Dakota Ave
- 1841 W 20th Ave
- 1825 W Renaissance Ave
- 1863 W 23rd Ave
- 2125 S Apache Dr
- 823 W 14th Ave
- 2131 S Cree Dr Unit 131
- 2167 W Miya Ave Unit 167
- 1017 W 22nd Ave
- 2193 S Weaver Dr
- 2240 S Rennick Dr
- 2224 S Rennick Dr
- 1016 W 23rd Ct
- 2256 S Rennick Dr
- 1035 W 22nd Ave
- 2185 S Weaver Dr
- 1006 W 23rd Ct
- 2326 S Rennick Dr Unit 10
- 1030 W 23rd Ct
- 948 W 22nd Ave
- 1028 W 22nd Ave
- 1051 W 22nd Ave
- 1048 W 23rd Ct
- 2342 S Rennick Dr
- 1044 W 22nd Ave
- 2223 S Rennick Dr
- 2239 S Rennick Dr
- 1067 W 22nd Ave
Your Personal Tour Guide
Ask me questions while you tour the home.