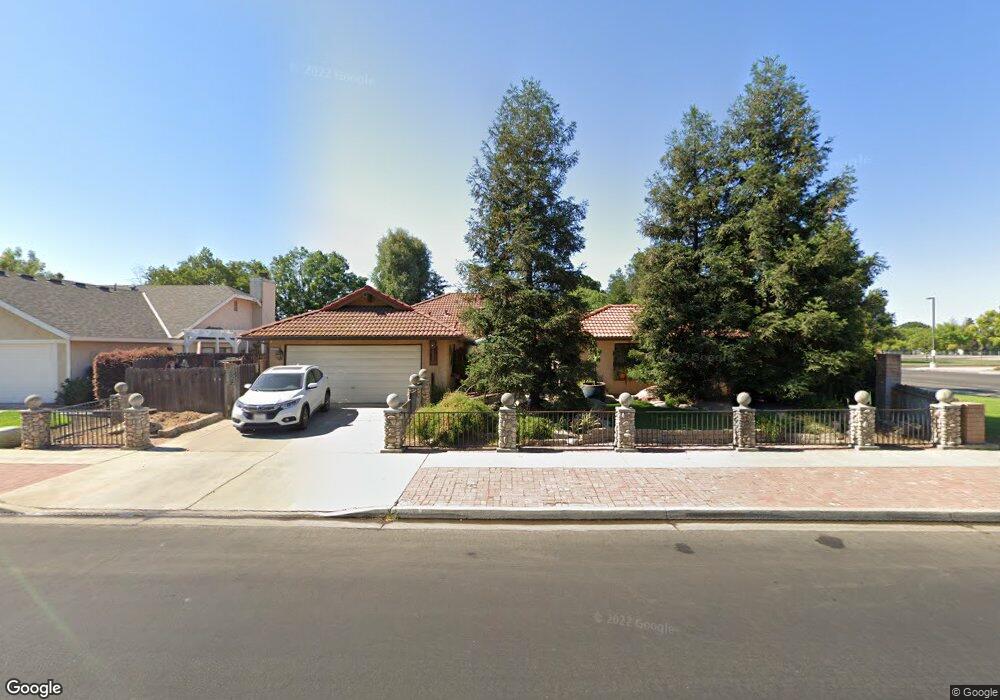
2212 Robinwood Ave Clovis, CA 93611
Estimated Value: $455,028 - $509,000
3
Beds
2
Baths
2,028
Sq Ft
$234/Sq Ft
Est. Value
About This Home
This home is located at 2212 Robinwood Ave, Clovis, CA 93611 and is currently estimated at $474,009, approximately $233 per square foot. 2212 Robinwood Ave is a home located in Fresno County with nearby schools including Clovis Elementary School, Clark Intermediate School, and Clovis High School.
Ownership History
Date
Name
Owned For
Owner Type
Purchase Details
Closed on
Nov 30, 2015
Sold by
Simi Nickolas A
Bought by
Simi Nickolas
Current Estimated Value
Purchase Details
Closed on
Feb 9, 2011
Sold by
Simi Donna T and Simi Nickolas A
Bought by
Simi Nickolas A
Home Financials for this Owner
Home Financials are based on the most recent Mortgage that was taken out on this home.
Original Mortgage
$242,400
Outstanding Balance
$165,553
Interest Rate
4.74%
Mortgage Type
New Conventional
Estimated Equity
$308,456
Purchase Details
Closed on
Sep 5, 2006
Sold by
Simi Donna T
Bought by
Simi Donna T and Simi Nickolas A
Purchase Details
Closed on
Sep 17, 2004
Sold by
Simi Lyman D
Bought by
Simi Donna T
Purchase Details
Closed on
Oct 2, 2001
Sold by
Va
Bought by
Simi Lyman D and Simi Donna T
Home Financials for this Owner
Home Financials are based on the most recent Mortgage that was taken out on this home.
Original Mortgage
$36,841
Interest Rate
6.46%
Mortgage Type
Stand Alone Second
Create a Home Valuation Report for This Property
The Home Valuation Report is an in-depth analysis detailing your home's value as well as a comparison with similar homes in the area
Home Values in the Area
Average Home Value in this Area
Purchase History
| Date | Buyer | Sale Price | Title Company |
|---|---|---|---|
| Simi Nickolas | -- | None Available | |
| Simi Nickolas A | -- | Fidelity National Title Co | |
| Simi Donna T | -- | Stewart Title Of California | |
| Simi Donna T | -- | -- | |
| Simi Lyman D | -- | -- |
Source: Public Records
Mortgage History
| Date | Status | Borrower | Loan Amount |
|---|---|---|---|
| Open | Simi Nickolas A | $242,400 | |
| Closed | Simi Lyman D | $36,841 | |
| Closed | Simi Lyman D | $155,470 |
Source: Public Records
Tax History
| Year | Tax Paid | Tax Assessment Tax Assessment Total Assessment is a certain percentage of the fair market value that is determined by local assessors to be the total taxable value of land and additions on the property. | Land | Improvement |
|---|---|---|---|---|
| 2025 | $2,854 | $227,028 | $56,279 | $170,749 |
| 2023 | $2,737 | $218,214 | $54,095 | $164,119 |
| 2022 | $2,703 | $213,936 | $53,035 | $160,901 |
| 2021 | $2,632 | $209,743 | $51,996 | $157,747 |
| 2020 | $2,622 | $207,593 | $51,463 | $156,130 |
| 2019 | $2,574 | $203,523 | $50,454 | $153,069 |
| 2018 | $2,522 | $199,533 | $49,465 | $150,068 |
| 2017 | $2,469 | $195,622 | $48,496 | $147,126 |
| 2016 | $2,390 | $191,788 | $47,546 | $144,242 |
| 2015 | $2,356 | $188,908 | $46,832 | $142,076 |
| 2014 | $2,315 | $185,208 | $45,915 | $139,293 |
Source: Public Records
Map
Nearby Homes
- 937 Filbert Ave
- 2034 Wrenwood Ave
- 2337 Wrenwood Ave
- 865 McKelvy Ave
- 2549 Purvis Ave
- 1895 Dennis Ave
- 1876 Cougar Ln
- 1584 Laverne Ave
- 1946 Calimyrna Ave
- 860 Mcarthur Ave
- 2518 Keats Ave
- 344 McKelvy Ave
- 793 Applegate Ave
- 2681 Wrenwood Ave
- 335 McKelvy Ave
- 1334 Shirley Ave
- 2043 Escalon Ave
- 2231 Escalon Ave
- 1273 Bundy Ave
- 2691 Morris Ave
- 2224 Robinwood Ave
- 1122 Filbert Ave
- 1111 Filbert Ave
- 2236 Robinwood Ave
- 986 Filbert Ave
- 974 Filbert Ave
- 1132 Filbert Ave
- 2248 Robinwood Ave
- 1121 Filbert Ave
- 973 Filbert Ave
- 962 Filbert Ave
- 961 Filbert Ave
- 1142 Filbert Ave
- 2260 Robinwood Ave
- 1131 Filbert Ave
- 1132 Jasmine Ave
- 949 Filbert Ave
- 2305 Lincoln Ave
- 972 Jasmine Ave
- 950 Filbert Ave
Your Personal Tour Guide
Ask me questions while you tour the home.