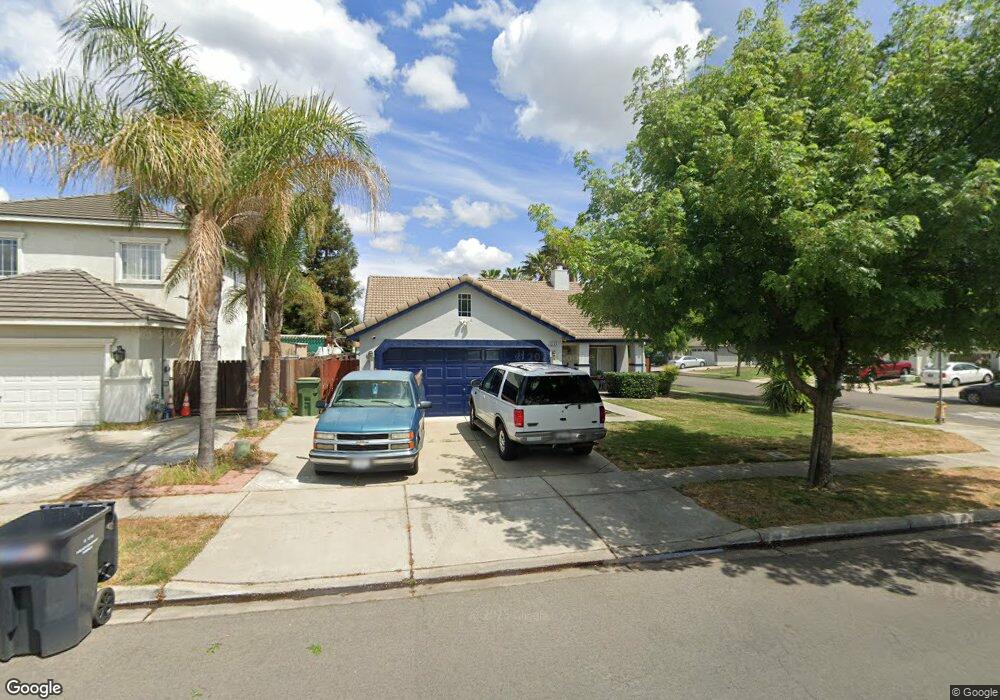
2226 Pinto Way Turlock, CA 95380
Estimated Value: $365,000 - $555,000
4
Beds
2
Baths
1,646
Sq Ft
$294/Sq Ft
Est. Value
About This Home
This home is located at 2226 Pinto Way, Turlock, CA 95380 and is currently estimated at $484,267, approximately $294 per square foot. 2226 Pinto Way is a home located in Stanislaus County with nearby schools including Walter M. Brown Elementary School, Turlock Junior High School, and Marvin A. Dutcher Middle School.
Ownership History
Date
Name
Owned For
Owner Type
Purchase Details
Closed on
Jun 13, 2016
Sold by
Thomas Lucy M
Bought by
Lucy M Thomas Trust
Current Estimated Value
Purchase Details
Closed on
Nov 26, 2014
Sold by
Thomas Lucy M and Craig Miguel A
Bought by
Thomas Lucy M
Home Financials for this Owner
Home Financials are based on the most recent Mortgage that was taken out on this home.
Original Mortgage
$397,500
Outstanding Balance
$288,622
Interest Rate
2.65%
Mortgage Type
Reverse Mortgage Home Equity Conversion Mortgage
Estimated Equity
$195,645
Purchase Details
Closed on
May 1, 2013
Sold by
Thomas Lucy M
Bought by
Thomas Lucy M and Craig Miguel A
Purchase Details
Closed on
Nov 28, 2001
Sold by
Mountain View Development Inc
Bought by
Thomas Benjamin L and Thomas Lucy M
Home Financials for this Owner
Home Financials are based on the most recent Mortgage that was taken out on this home.
Original Mortgage
$62,500
Interest Rate
6.57%
Mortgage Type
Stand Alone First
Create a Home Valuation Report for This Property
The Home Valuation Report is an in-depth analysis detailing your home's value as well as a comparison with similar homes in the area
Home Values in the Area
Average Home Value in this Area
Purchase History
| Date | Buyer | Sale Price | Title Company |
|---|---|---|---|
| Lucy M Thomas Trust | -- | None Available | |
| Thomas Lucy M | $133,000 | None Available | |
| Thomas Lucy M | -- | None Available | |
| Thomas Benjamin L | $199,000 | Chicago Title Co |
Source: Public Records
Mortgage History
| Date | Status | Borrower | Loan Amount |
|---|---|---|---|
| Open | Thomas Lucy M | $397,500 | |
| Closed | Thomas Benjamin L | $62,500 |
Source: Public Records
Tax History Compared to Growth
Tax History
| Year | Tax Paid | Tax Assessment Tax Assessment Total Assessment is a certain percentage of the fair market value that is determined by local assessors to be the total taxable value of land and additions on the property. | Land | Improvement |
|---|---|---|---|---|
| 2025 | $3,234 | $293,961 | $59,080 | $234,881 |
| 2024 | $3,443 | $288,198 | $57,922 | $230,276 |
| 2023 | $3,634 | $282,548 | $56,787 | $225,761 |
| 2022 | $3,586 | $277,009 | $55,674 | $221,335 |
| 2021 | $3,460 | $271,579 | $54,583 | $216,996 |
| 2020 | $3,426 | $268,795 | $54,024 | $214,771 |
| 2019 | $3,345 | $263,525 | $52,965 | $210,560 |
| 2018 | $3,340 | $258,359 | $51,927 | $206,432 |
| 2017 | $3,224 | $253,294 | $50,909 | $202,385 |
| 2016 | $3,036 | $248,328 | $49,911 | $198,417 |
| 2015 | $2,999 | $244,599 | $49,162 | $195,437 |
| 2014 | $2,515 | $199,000 | $50,000 | $149,000 |
Source: Public Records
Map
Nearby Homes
- 2391 Typhoon Dr
- 2226 Typhoon Ct
- 2531 Craftsman St
- 2141 Royal Wood Ln
- 2620 Bird Rock Place
- 2800 Craftsman St
- 1827 Shadow Park Dr
- 2400 Fulkerth Rd
- 3000 W Tuolumne Rd
- 2450 Fulkerth Rd
- 2631 Polous Dr
- 2500 Hampton Way
- 1357 Mark Ct
- 2430 Trellis Ln
- 1531 Yorktown Ct
- 2123 Spring Blossom Ln
- 1400 N Tully Rd Unit 173
- 1400 N Tully Rd Unit 187
- 1400 N Tully Rd Unit 137
- 1400 N Tully Rd Unit 91
- 2236 Pinto Way
- 2227 Pacer Way
- 2246 Pinto Way
- 2237 Pacer Way
- 2424 Sorrel Dr
- 2444 Sorrel Dr
- 2247 Pacer Way
- 2414 Sorrel Dr
- 2256 Pinto Way
- 2257 Pacer Way
- 2404 Sorrel Dr
- 2266 Pinto Way
- 2384 Sorrel Dr
- 2267 Pacer Way
- 2467 Arabian Way
- 2447 Arabian Way
- 2226 Pacer Way
- 2236 Pacer Way
- 2374 Sorrel Dr
- 2246 Pacer Way