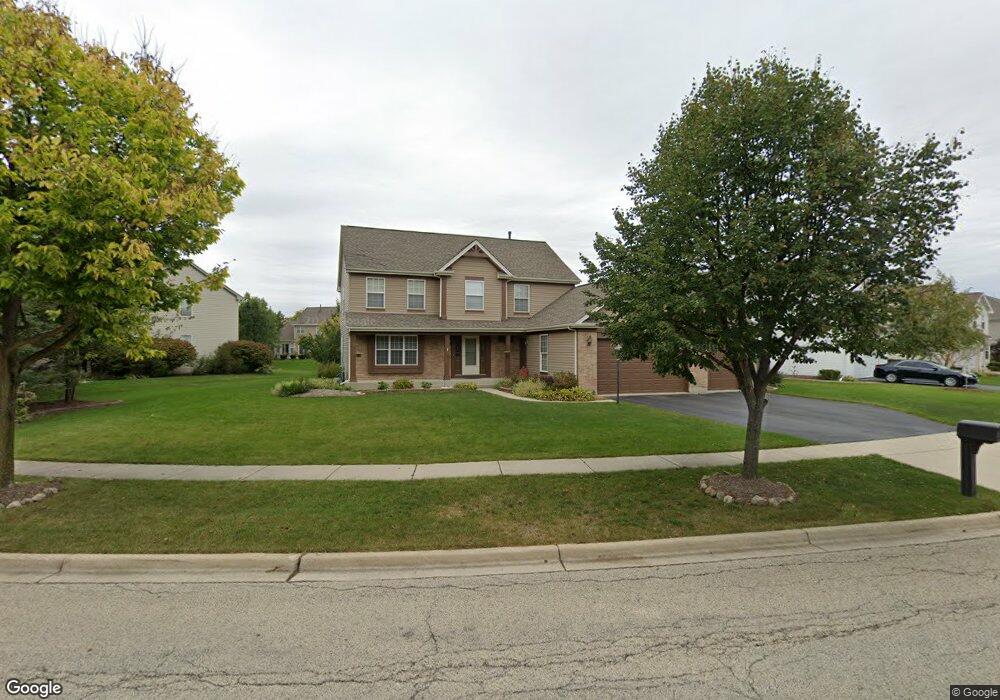
2236 Moser Ln Algonquin, IL 60102
Estimated Value: $469,244 - $548,000
4
Beds
--
Bath
2,508
Sq Ft
$206/Sq Ft
Est. Value
About This Home
This home is located at 2236 Moser Ln, Algonquin, IL 60102 and is currently estimated at $515,811, approximately $205 per square foot. 2236 Moser Ln is a home located in Kane County with nearby schools including Westfield Community School, Harry D Jacobs High School, and St Margaret Mary Catholic School.
Ownership History
Date
Name
Owned For
Owner Type
Purchase Details
Closed on
Jan 30, 1998
Sold by
Willoughby Farms Third New Dimensions Lt
Bought by
Gottardo Frank J and Gottardo Michelle L
Current Estimated Value
Home Financials for this Owner
Home Financials are based on the most recent Mortgage that was taken out on this home.
Original Mortgage
$173,000
Outstanding Balance
$30,844
Interest Rate
7.08%
Estimated Equity
$484,967
Create a Home Valuation Report for This Property
The Home Valuation Report is an in-depth analysis detailing your home's value as well as a comparison with similar homes in the area
Purchase History
| Date | Buyer | Sale Price | Title Company |
|---|---|---|---|
| Gottardo Frank J | $227,500 | Stewart Title Company |
Source: Public Records
Mortgage History
| Date | Status | Borrower | Loan Amount |
|---|---|---|---|
| Open | Gottardo Frank J | $173,000 |
Source: Public Records
Tax History
| Year | Tax Paid | Tax Assessment Tax Assessment Total Assessment is a certain percentage of the fair market value that is determined by local assessors to be the total taxable value of land and additions on the property. | Land | Improvement |
|---|---|---|---|---|
| 2024 | $10,456 | $145,527 | $25,730 | $119,797 |
| 2023 | $10,006 | $130,940 | $23,151 | $107,789 |
| 2022 | $9,367 | $118,082 | $23,151 | $94,931 |
| 2021 | $9,097 | $111,493 | $21,859 | $89,634 |
| 2020 | $8,922 | $108,987 | $21,368 | $87,619 |
| 2019 | $8,654 | $103,462 | $20,285 | $83,177 |
| 2018 | $8,797 | $101,413 | $19,883 | $81,530 |
| 2017 | $8,449 | $94,868 | $18,600 | $76,268 |
| 2016 | $8,209 | $87,298 | $18,009 | $69,289 |
| 2015 | -- | $80,152 | $17,040 | $63,112 |
| 2014 | -- | $75,084 | $16,569 | $58,515 |
| 2013 | -- | $77,382 | $17,076 | $60,306 |
Source: Public Records
Map
Nearby Homes
- 1201 Waterford St
- 1211 Waterford St
- 2313 Barrett Dr
- 2224 Barrett Dr
- 1231 Waterford St
- 1121 Waterford St
- 1101 Waterford St
- 2030 Cosman Way
- 120 Newburgh Ln
- 2040 Cosman Way
- 2050 Cosman Way
- 150 Newburgh Ln
- 2060 Cosman Way
- 2070 Cosman Way
- 1000 Glenmont St
- 2254 Stonegate Rd
- 2248 Stonegate Rd
- 2240 Stonegate Rd
- 1090 Glenmont St
- 1247 Glenmont St
Your Personal Tour Guide
Ask me questions while you tour the home.