2239 W 10th St Indianapolis, IN 46222
Haughville NeighborhoodEstimated payment $439/month
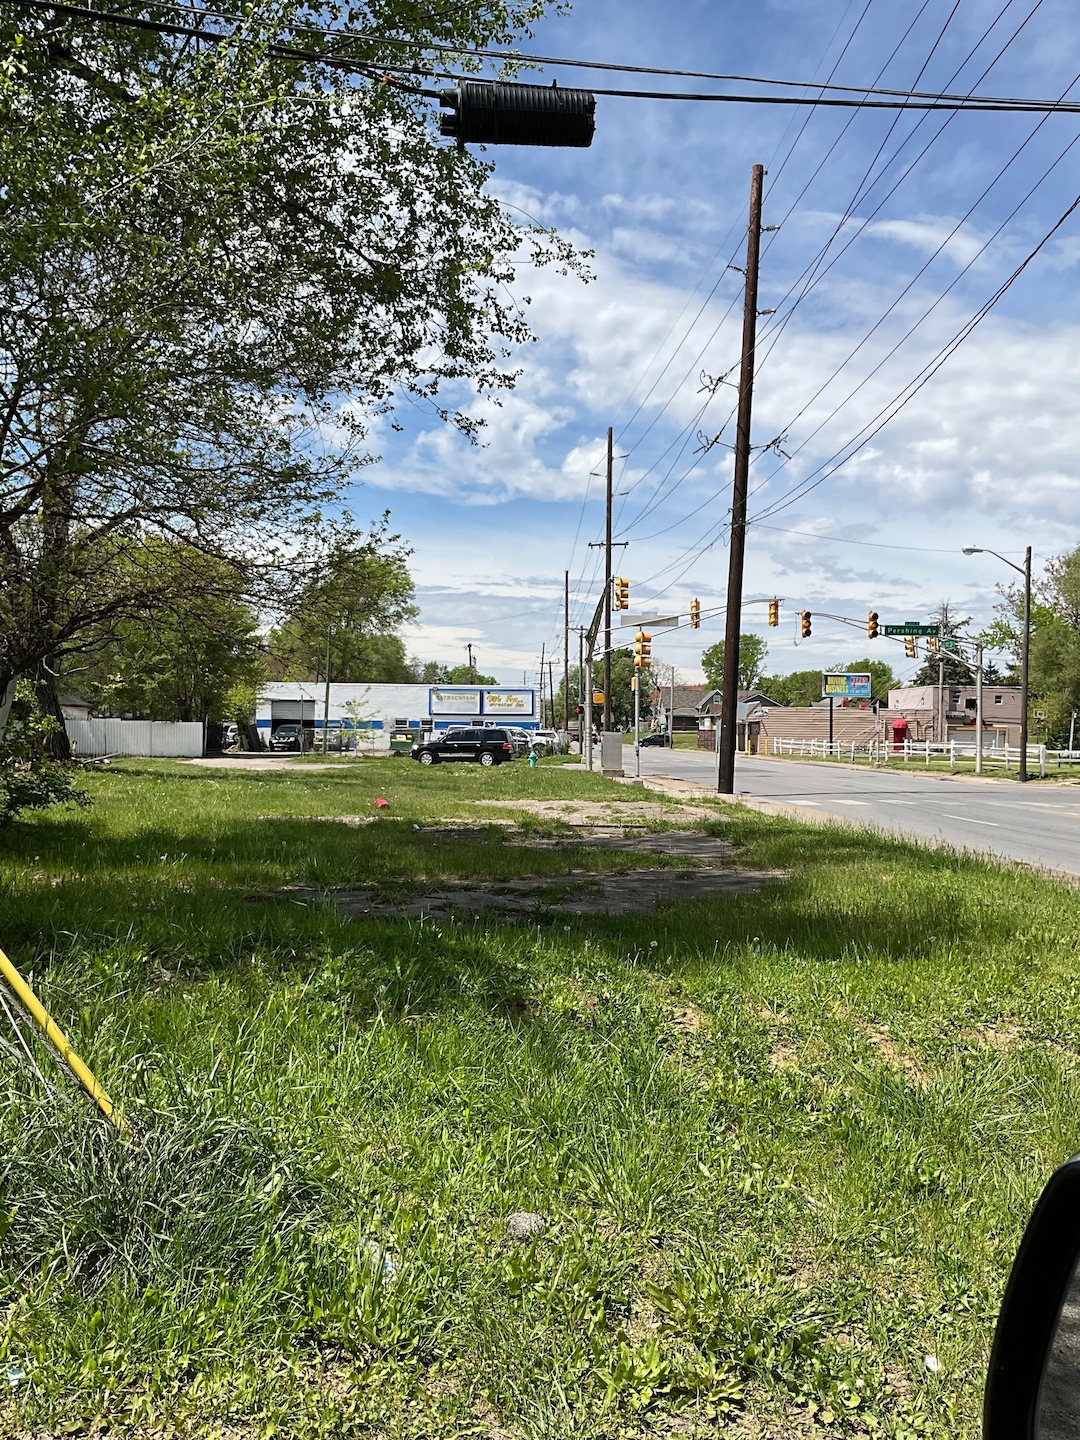
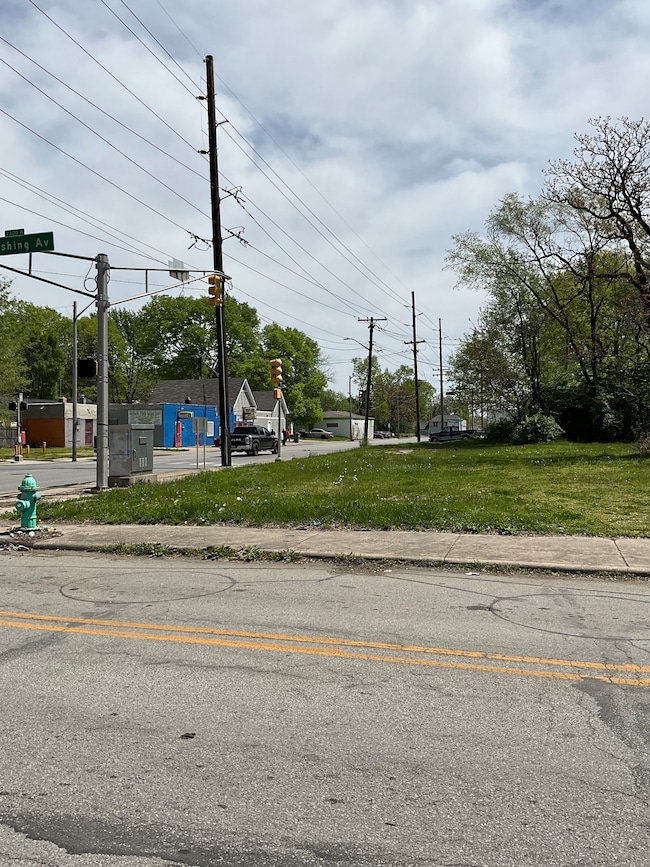
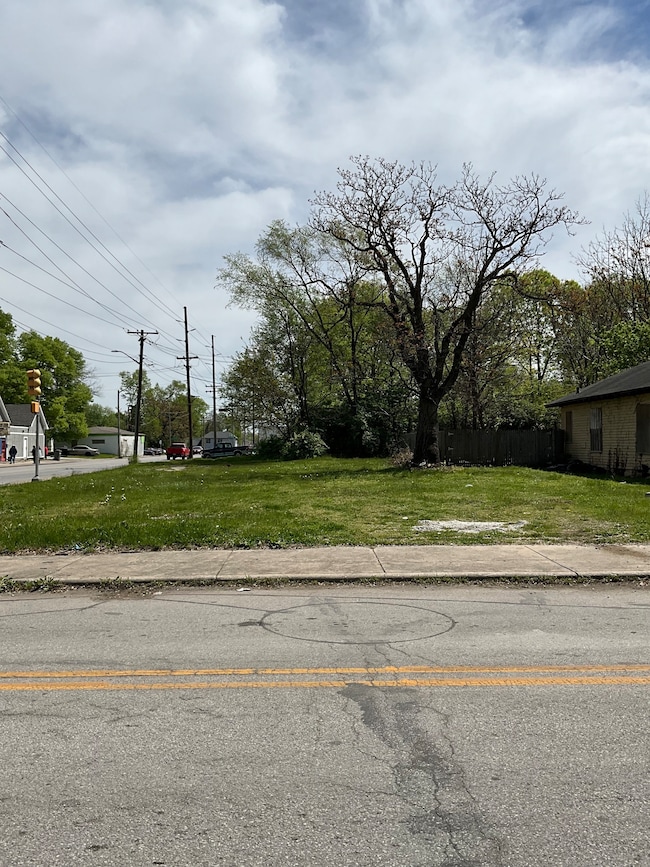
About This Lot
Double lot at busy intersection
Property Details
Property Type
- Land
Est. Annual Taxes
- $206
Lot Details
- 0.26 Acre Lot
- Additional Parcels
Community Details
- John Trost Subdivision
Listing and Financial Details
- Tax Lot JOHN TROSTS JRS 2ND HAUGHVILLE SUBDIVISIONL25 B20, L26 B20 & 5' VAC ST N & ADJ L25 B20
- Assessor Parcel Number 491104117003000901
Map
Home Values in the Area
Average Home Value in this Area
Tax History
| Year | Tax Paid | Tax Assessment Tax Assessment Total Assessment is a certain percentage of the fair market value that is determined by local assessors to be the total taxable value of land and additions on the property. | Land | Improvement |
|---|---|---|---|---|
| 2024 | $206 | $8,700 | $8,700 | -- |
| 2023 | $206 | $8,700 | $8,700 | $0 |
| 2022 | $205 | $8,700 | $8,700 | $0 |
| 2021 | $235 | $8,700 | $8,700 | $0 |
| 2020 | $235 | $8,700 | $8,700 | $0 |
| 2019 | $238 | $8,700 | $8,700 | $0 |
| 2018 | $238 | $8,700 | $8,700 | $0 |
| 2017 | $215 | $8,700 | $8,700 | $0 |
| 2016 | $210 | $8,700 | $8,700 | $0 |
| 2014 | $188 | $8,700 | $8,700 | $0 |
| 2013 | $181 | $8,700 | $8,700 | $0 |
Property History
| Date | Event | Price | List to Sale | Price per Sq Ft |
|---|---|---|---|---|
| 09/30/2025 09/30/25 | Price Changed | $80,000 | -20.0% | -- |
| 08/27/2025 08/27/25 | For Sale | $100,000 | 0.0% | -- |
| 08/25/2025 08/25/25 | Off Market | $100,000 | -- | -- |
| 09/30/2024 09/30/24 | For Sale | $100,000 | 0.0% | -- |
| 09/25/2024 09/25/24 | Off Market | $100,000 | -- | -- |
| 04/26/2024 04/26/24 | For Sale | $100,000 | -- | -- |
Source: MIBOR Broker Listing Cooperative®
MLS Number: 21976137
APN: 49-11-04-117-003.000-901
Disclaimer: Certain information contained herein is derived from information provided by parties other than Homes.com. All information provided is deemed reliable, but is not guaranteed to be accurate and should be independently verified.
![]() Based on information submitted to the MLS GRID. All data is obtained from various sources and may not have been verified by broker or MLS GRID. Supplied Open House Information is subject to change without notice. All information should be independently reviewed and verified for accuracy. Properties may or may not be listed by the office/agent presenting the information. Some IDX listings have been excluded from this website.
Based on information submitted to the MLS GRID. All data is obtained from various sources and may not have been verified by broker or MLS GRID. Supplied Open House Information is subject to change without notice. All information should be independently reviewed and verified for accuracy. Properties may or may not be listed by the office/agent presenting the information. Some IDX listings have been excluded from this website.
- 1017 N Concord St
- 1047 N Concord St
- 805 N Goodlet Ave
- 1031 N Centennial St
- 1035 N Centennial St
- 1041 N Centennial St
- 1111 Medford Ave
- 1032 Groff Ave
- 1169 N Goodlet Ave
- 954 N Moreland Ave
- 1152 Winfield Ave
- 1148 Winfield Ave
- 1205 N Centennial St
- 1209 N Centennial St
- 1205 Winfield Ave
- 1051 N Holmes Ave
- 1110 N Tibbs Ave
- 1317 Sharon Ave
- 1135 N Holmes Ave
- 525 N Concord St
- 952 N Concord St
- 3014 W 10th St Unit 1
- 3014 W 10th St Unit 4
- 2932 W 11th St
- 734 N Arnolda Ave
- 1029 N Holmes Ave
- 520 N Moreland Ave Unit A
- 1005 N Pershing Ave
- 742 N Sheffield Ave Unit ID1228636P
- 319 Steeples Blvd
- 3105 Bolton Square Blvd
- 315 Steeples Blvd
- 2923 W New York St
- 2901 W New York St
- 1033 N Belmont Ave
- 1230 N Belmont Ave Unit D
- 2152 Emrich Ln
- 2949 Kirkbride Way
- 1948 W Michigan St
- 1937 King Ave
