Estimated Value: $246,000 - $354,080
1
Bed
1
Bath
720
Sq Ft
$389/Sq Ft
Est. Value
About This Home
This home is located at 2250 S Calhan Hwy, Yoder, CO 80864 and is currently estimated at $279,770, approximately $388 per square foot. 2250 S Calhan Hwy is a home located in El Paso County with nearby schools including Miami/Yoder Elementary School and Miami-Yoder Middle - High School.
Ownership History
Date
Name
Owned For
Owner Type
Purchase Details
Closed on
Jul 29, 2016
Sold by
Clarke Lachalan A and Clarke Linda I
Bought by
Anderson Jill L
Current Estimated Value
Home Financials for this Owner
Home Financials are based on the most recent Mortgage that was taken out on this home.
Original Mortgage
$133,676
Outstanding Balance
$106,658
Interest Rate
3.48%
Mortgage Type
New Conventional
Estimated Equity
$173,112
Purchase Details
Closed on
Jul 18, 2003
Sold by
Christianson John
Bought by
Clarke Lachlan A and Clarke Linda L
Home Financials for this Owner
Home Financials are based on the most recent Mortgage that was taken out on this home.
Original Mortgage
$127,991
Interest Rate
5.15%
Mortgage Type
Purchase Money Mortgage
Purchase Details
Closed on
Feb 1, 2000
Sold by
Ellicott Heights Ranch Llc
Bought by
Christianson John
Create a Home Valuation Report for This Property
The Home Valuation Report is an in-depth analysis detailing your home's value as well as a comparison with similar homes in the area
Home Values in the Area
Average Home Value in this Area
Purchase History
| Date | Buyer | Sale Price | Title Company |
|---|---|---|---|
| Anderson Jill L | $130,000 | Legacy Title Group Llc | |
| Clarke Lachlan A | $130,000 | Land Title Guarantee Company | |
| Christianson John | $35,000 | Land Title |
Source: Public Records
Mortgage History
| Date | Status | Borrower | Loan Amount |
|---|---|---|---|
| Open | Anderson Jill L | $133,676 | |
| Previous Owner | Clarke Lachlan A | $127,991 |
Source: Public Records
Tax History
| Year | Tax Paid | Tax Assessment Tax Assessment Total Assessment is a certain percentage of the fair market value that is determined by local assessors to be the total taxable value of land and additions on the property. | Land | Improvement |
|---|---|---|---|---|
| 2025 | $659 | $21,020 | -- | -- |
| 2024 | $585 | $20,720 | $3,860 | $16,860 |
| 2023 | $585 | $20,720 | $3,860 | $16,860 |
| 2022 | $479 | $12,400 | $3,060 | $9,340 |
| 2021 | $515 | $12,760 | $3,150 | $9,610 |
| 2020 | $467 | $11,050 | $3,150 | $7,900 |
| 2019 | $475 | $11,050 | $3,150 | $7,900 |
| 2018 | $438 | $9,710 | $3,170 | $6,540 |
| 2017 | $416 | $9,710 | $3,170 | $6,540 |
| 2016 | $405 | $9,380 | $3,350 | $6,030 |
| 2015 | $406 | $9,380 | $3,350 | $6,030 |
| 2014 | $506 | $8,930 | $3,350 | $5,580 |
Source: Public Records
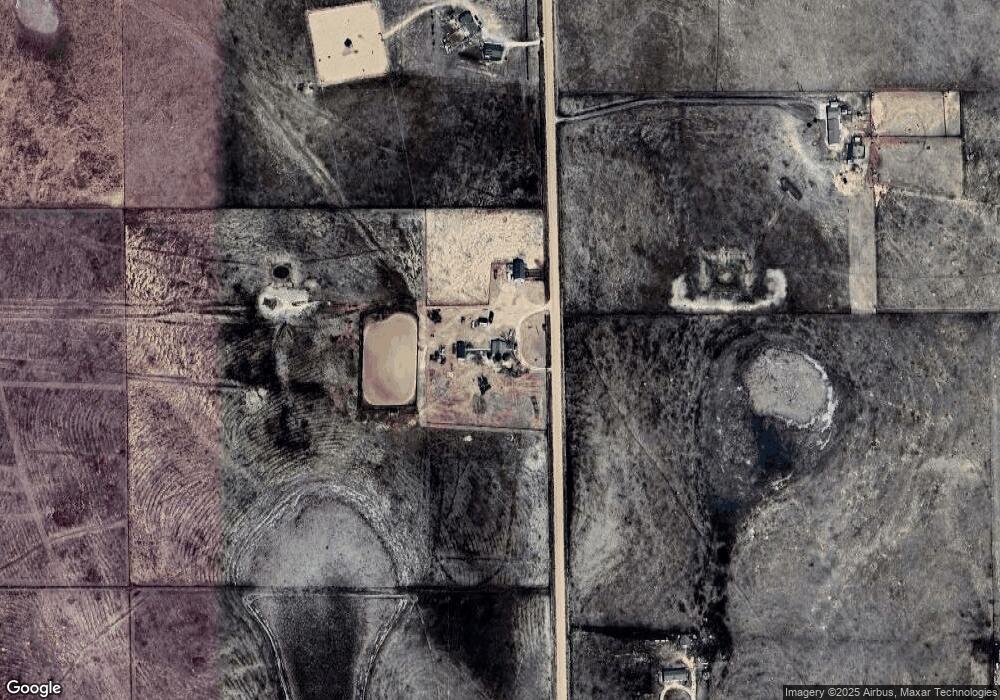
Map
Nearby Homes
- 0 Equestrian Point
- 930 Awesome View
- 755 High Prairie Point
- 29895 Cross Bow Ct
- 29866 Cross Bow Ct
- 29835 Cross Bow Ct
- 29805 Cross Bow Ct
- 29865 Cross Bow Ct
- 29806 Cross Bow Ct
- 251 Blue Duck Way
- 211 Blue Duck Way
- 29848 Lonesome Dove Ln
- 29888 Lonesome Dove Ln
- 30008 Lonesome Dove Ln
- 110 N Dinner Bell Dr
- 79 N Dinner Bell Dr
- 174 N Dinner Bell Dr
- 46 N Dinner Bell Dr
- 142 N Dinner Bell Dr
- 78 N Dinner Bell Dr
- 6 Book
- Parcel 3 S Calhan Hwy
- S S Calhan Hwy
- 0 S Calhan Hwy Unit 8824229
- 0 S Calhan Hwy Unit 1827663
- 1830 S Calhan Hwy
- 1830 S Calhan Hwy
- 30924 Rusty Bucket Point
- 1955 S Calhan Hwy
- 1835 S Calhan Hwy
- 31336 Rusty Bucket Point
- 1715 S Calhan Hwy
- 1650 S Calhan Hwy
- 2145 Awesome View
- 1595 S Calhan Hwy
- 2270 S Calhan Hwy
- 1925 Awesome View
- 2180 Awesome View
- 2365 Awesome View
- 000 S Calhan Hwy
Your Personal Tour Guide
Ask me questions while you tour the home.