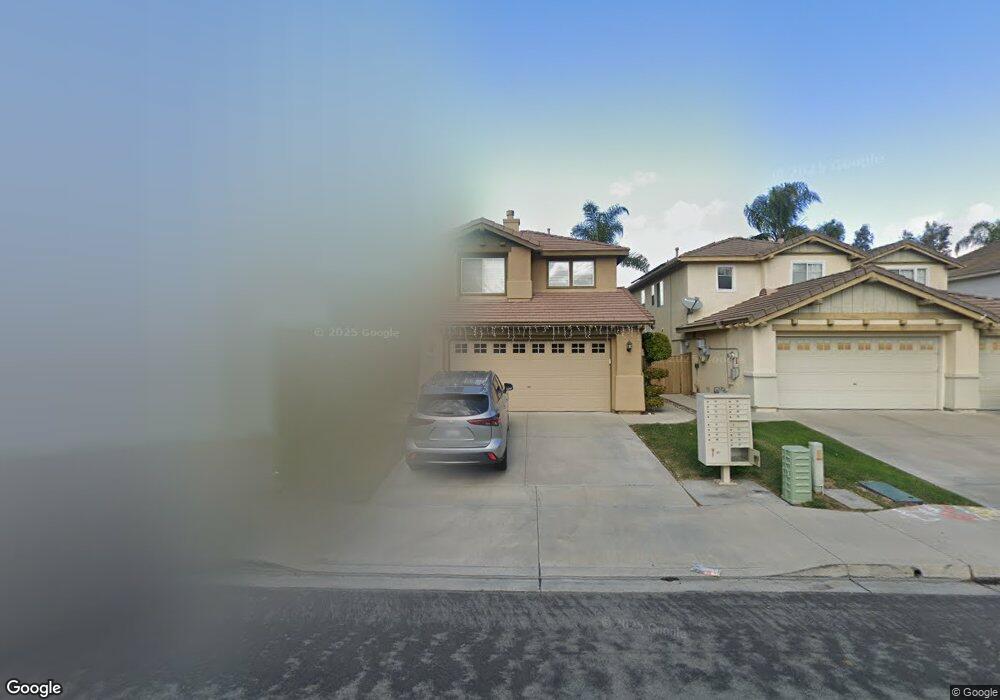
2263 Sun Valley Rd Chula Vista, CA 91915
Eastlake NeighborhoodEstimated Value: $912,603 - $981,000
4
Beds
3
Baths
1,887
Sq Ft
$500/Sq Ft
Est. Value
About This Home
This home is located at 2263 Sun Valley Rd, Chula Vista, CA 91915 and is currently estimated at $943,651, approximately $500 per square foot. 2263 Sun Valley Rd is a home located in San Diego County with nearby schools including Olympic View Elementary School, Eastlake Middle School, and Eastlake High School.
Ownership History
Date
Name
Owned For
Owner Type
Purchase Details
Closed on
Oct 25, 2006
Sold by
Lastrella Phillip D and Lastrella Alma L
Bought by
Lastrella Phillip and Lastrella Alma
Current Estimated Value
Purchase Details
Closed on
Feb 10, 2006
Sold by
Lastrella Phillip D and Lastrella Alma L
Bought by
Lastrella Phillip D and Lastrella Alma L
Home Financials for this Owner
Home Financials are based on the most recent Mortgage that was taken out on this home.
Original Mortgage
$400,000
Outstanding Balance
$234,822
Interest Rate
1.55%
Mortgage Type
Negative Amortization
Estimated Equity
$708,829
Purchase Details
Closed on
Aug 20, 1996
Sold by
Kaufman & Broad Of San Diego
Bought by
Lastrella Phillip D and Lastrella Alma L
Home Financials for this Owner
Home Financials are based on the most recent Mortgage that was taken out on this home.
Original Mortgage
$202,969
Interest Rate
8.3%
Mortgage Type
VA
Create a Home Valuation Report for This Property
The Home Valuation Report is an in-depth analysis detailing your home's value as well as a comparison with similar homes in the area
Home Values in the Area
Average Home Value in this Area
Purchase History
| Date | Buyer | Sale Price | Title Company |
|---|---|---|---|
| Lastrella Phillip | -- | None Available | |
| Lastrella Phillip D | -- | Alliance Title Company | |
| Lastrella Phillip D | $199,000 | First American Title |
Source: Public Records
Mortgage History
| Date | Status | Borrower | Loan Amount |
|---|---|---|---|
| Open | Lastrella Phillip D | $400,000 | |
| Previous Owner | Lastrella Phillip D | $202,969 |
Source: Public Records
Tax History Compared to Growth
Tax History
| Year | Tax Paid | Tax Assessment Tax Assessment Total Assessment is a certain percentage of the fair market value that is determined by local assessors to be the total taxable value of land and additions on the property. | Land | Improvement |
|---|---|---|---|---|
| 2025 | $3,652 | $323,920 | $105,850 | $218,070 |
| 2024 | $3,652 | $317,570 | $103,775 | $213,795 |
| 2023 | $3,590 | $311,344 | $101,741 | $209,603 |
| 2022 | $3,488 | $305,241 | $99,747 | $205,494 |
| 2021 | $4,648 | $299,257 | $97,792 | $201,465 |
| 2020 | $4,537 | $296,190 | $96,790 | $199,400 |
| 2019 | $4,422 | $290,384 | $94,893 | $195,491 |
| 2018 | $4,342 | $284,691 | $93,033 | $191,658 |
| 2017 | $4,262 | $279,109 | $91,209 | $187,900 |
| 2016 | $4,343 | $273,637 | $89,421 | $184,216 |
| 2015 | $4,293 | $269,527 | $88,078 | $181,449 |
| 2014 | $4,729 | $264,248 | $86,353 | $177,895 |
Source: Public Records
Map
Nearby Homes
- 1220 Silverado Dr
- 2408 Green River Dr
- 1246 Boca Raton Dr
- 1215 Pinehurst Rd
- 2181 Caminito Norina Unit 134
- 2088 Bravo Loop
- 2065 Bravo Loop Unit 6
- 1338 Caminito Fabrizio Unit 72
- 2300 Palomira Ct
- 1445 Caminito Sicilia
- 1446 Caminito Sardinia
- 0 Towncenter Lot#4
- 2235 Old Barn Ln
- 1405 Sulu Sea Ln Unit 4
- 1020 Baywood Cir Unit E
- 1452 S Creekside Dr
- 2505 Whispering Palms Loop
- 1277 Granite Springs Dr
- 0 Towncenter Lot#3
- 0 Towncenter Lot#30
- 2259 Sun Valley Rd
- 2267 Sun Valley Rd
- 2255 Sun Valley Rd
- 2271 Sun Valley Rd
- 2292 Green River Dr
- 2288 Green River Dr
- 2296 Green River Dr
- 2251 Sun Valley Rd
- 2282 Green River Dr
- 2264 Sun Valley Rd
- 2254 Sun Valley Rd
- 2260 Sun Valley Rd
- 2268 Sun Valley Rd
- 2247 Sun Valley Rd
- 2278 Green River Dr
- 2272 Sun Valley Rd Unit 4
- 2246 Sun Valley Rd
- 2275 Sun Valley Rd
- 2274 Sun Valley Rd
- 2304 Green River Dr