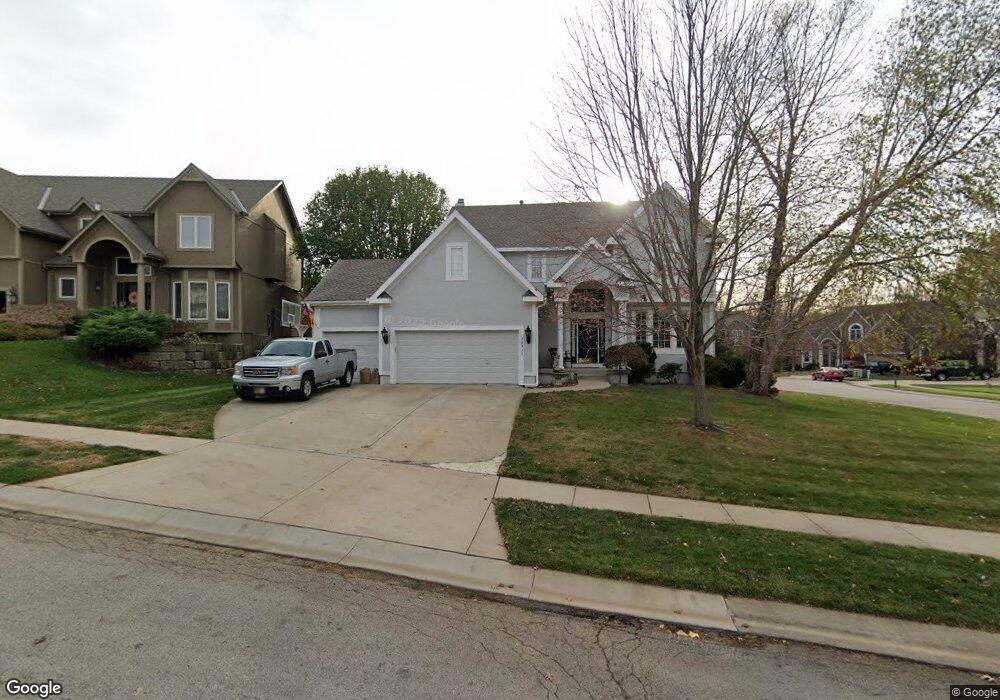
22717 W 46th Terrace Shawnee, KS 66226
Estimated Value: $536,831 - $563,000
4
Beds
4
Baths
2,700
Sq Ft
$203/Sq Ft
Est. Value
About This Home
This home is located at 22717 W 46th Terrace, Shawnee, KS 66226 and is currently estimated at $548,958, approximately $203 per square foot. 22717 W 46th Terrace is a home located in Johnson County with nearby schools including Riverview Elementary School, Mill Creek Middle School, and Mill Valley High School.
Ownership History
Date
Name
Owned For
Owner Type
Purchase Details
Closed on
May 27, 2004
Sold by
Norman Phillip A and Norman Belinda D
Bought by
Mayfield Edward C and Mayfield Julie D
Current Estimated Value
Purchase Details
Closed on
Oct 9, 2001
Sold by
Duggan Homes Inc
Bought by
Norman Phillip A and Norman Belinda D
Home Financials for this Owner
Home Financials are based on the most recent Mortgage that was taken out on this home.
Original Mortgage
$209,200
Interest Rate
6.77%
Purchase Details
Closed on
May 24, 2001
Sold by
Crimson Ridge Partners Llc
Bought by
Duggan Homes Inc
Home Financials for this Owner
Home Financials are based on the most recent Mortgage that was taken out on this home.
Original Mortgage
$170,000
Interest Rate
7.07%
Mortgage Type
Construction
Create a Home Valuation Report for This Property
The Home Valuation Report is an in-depth analysis detailing your home's value as well as a comparison with similar homes in the area
Home Values in the Area
Average Home Value in this Area
Purchase History
| Date | Buyer | Sale Price | Title Company |
|---|---|---|---|
| Mayfield Edward C | -- | Stewart Title | |
| Norman Phillip A | -- | Security Land Title Company | |
| Duggan Homes Inc | -- | Security Land Title Company |
Source: Public Records
Mortgage History
| Date | Status | Borrower | Loan Amount |
|---|---|---|---|
| Previous Owner | Norman Phillip A | $209,200 | |
| Previous Owner | Duggan Homes Inc | $170,000 |
Source: Public Records
Tax History Compared to Growth
Tax History
| Year | Tax Paid | Tax Assessment Tax Assessment Total Assessment is a certain percentage of the fair market value that is determined by local assessors to be the total taxable value of land and additions on the property. | Land | Improvement |
|---|---|---|---|---|
| 2024 | $6,285 | $53,947 | $9,949 | $43,998 |
| 2023 | $5,918 | $50,313 | $9,949 | $40,364 |
| 2022 | $5,180 | $43,159 | $8,656 | $34,503 |
| 2021 | $5,076 | $40,664 | $7,871 | $32,793 |
| 2020 | $4,843 | $38,445 | $7,871 | $30,574 |
| 2019 | $4,537 | $35,477 | $5,638 | $29,839 |
| 2018 | $4,618 | $35,799 | $5,638 | $30,161 |
| 2017 | $4,653 | $35,190 | $5,638 | $29,552 |
| 2016 | $4,491 | $33,545 | $5,638 | $27,907 |
| 2015 | $4,456 | $32,694 | $5,638 | $27,056 |
| 2013 | -- | $29,210 | $5,638 | $23,572 |
Source: Public Records
Map
Nearby Homes
- 22912 W 47th Terrace
- 22611 W 46th Terrace
- 4638 Aminda St
- 4420 Anderson St
- 4403 Silverheel St
- 22714 W 49th St
- 9307 Aminda St
- 9303 Aminda St
- 9313 Aminda St
- 9305 Aminda St
- 22625 W 49th St
- 22910 W 51st St
- 22014 W 47th Terrace
- 5005 Hilltop Dr
- 22014 W 51st St
- 4707 Noreston St
- 5116 Payne St
- 5221 Meadow View Dr
- 5137 Meadowlark Dr
- 22115 W 51st Terrace
- 22713 W 46th Terrace
- 4641 Roberts St
- 4640 Roberts St
- 4636 Roberts St
- 22709 W 46th Terrace
- 22716 W 46th Terrace
- 4644 Roberts St
- 4632 Roberts St
- 22708 W 46th Terrace
- 4648 Roberts St
- 22705 W 46th Terrace
- 4628 Roberts St
- 4652 Roberts St
- 4627 Roberts St
- 4624 Roberts St
- 22701 W 46th Terrace
- 4630 Anderson St
- 4623 Roberts St
- 4626 Anderson St
- 4620 Roberts St