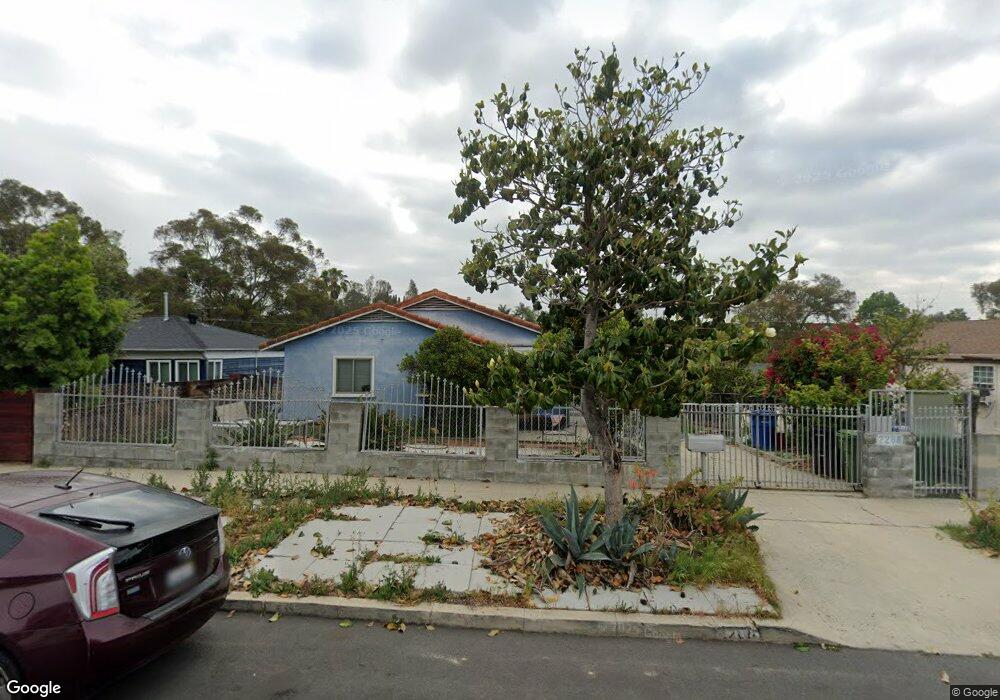
2288 Highbury Ave Los Angeles, CA 90032
El Sereno NeighborhoodEstimated Value: $923,000 - $985,000
4
Beds
2
Baths
1,606
Sq Ft
$595/Sq Ft
Est. Value
About This Home
This home is located at 2288 Highbury Ave, Los Angeles, CA 90032 and is currently estimated at $955,787, approximately $595 per square foot. 2288 Highbury Ave is a home located in Los Angeles County with nearby schools including Multnomah Street Elementary, El Sereno Middle School, and Woodrow Wilson Senior High.
Ownership History
Date
Name
Owned For
Owner Type
Purchase Details
Closed on
Mar 11, 2009
Sold by
Ta Mai T
Bought by
Ta Mai T and The Mai T Ta Family Trust
Current Estimated Value
Home Financials for this Owner
Home Financials are based on the most recent Mortgage that was taken out on this home.
Original Mortgage
$220,000
Outstanding Balance
$139,147
Interest Rate
5.03%
Mortgage Type
New Conventional
Estimated Equity
$816,640
Purchase Details
Closed on
Dec 22, 2007
Sold by
Darakorn Mary
Bought by
Ta Mai T and The Mai T Ta Family Trust
Purchase Details
Closed on
Oct 15, 2007
Sold by
Hsieh Jason
Bought by
Ta Mai and The Mai T Ta Family Trust
Purchase Details
Closed on
Oct 10, 2007
Sold by
Banh Helen Nga Ta
Bought by
Ta Mai T and The Mai T Ta Family Trust
Purchase Details
Closed on
Apr 23, 2007
Sold by
Ta Mai T and The Mai T Ta Family Trust
Bought by
Banh Helen Nga Ta and Hsieh Jason
Purchase Details
Closed on
Sep 27, 2004
Sold by
Ta Mai T
Bought by
Ta Mai T and The Mai T Ta Family Trust
Create a Home Valuation Report for This Property
The Home Valuation Report is an in-depth analysis detailing your home's value as well as a comparison with similar homes in the area
Home Values in the Area
Average Home Value in this Area
Purchase History
| Date | Buyer | Sale Price | Title Company |
|---|---|---|---|
| Ta Mai T | -- | Ticor Title Company | |
| Ta Mai T | -- | Ticor Title Company | |
| Ta Mai T | -- | None Available | |
| Ta Mai | -- | None Available | |
| Ta Mai T | -- | None Available | |
| Banh Helen Nga Ta | -- | None Available | |
| Ta Mai T | -- | -- |
Source: Public Records
Mortgage History
| Date | Status | Borrower | Loan Amount |
|---|---|---|---|
| Open | Ta Mai T | $220,000 |
Source: Public Records
Tax History Compared to Growth
Tax History
| Year | Tax Paid | Tax Assessment Tax Assessment Total Assessment is a certain percentage of the fair market value that is determined by local assessors to be the total taxable value of land and additions on the property. | Land | Improvement |
|---|---|---|---|---|
| 2025 | $3,893 | $305,213 | $160,692 | $144,521 |
| 2024 | $3,893 | $299,230 | $157,542 | $141,688 |
| 2023 | $3,822 | $293,363 | $154,453 | $138,910 |
| 2022 | $3,652 | $287,612 | $151,425 | $136,187 |
| 2021 | $3,601 | $281,973 | $148,456 | $133,517 |
| 2019 | $3,497 | $273,610 | $144,053 | $129,557 |
| 2018 | $3,374 | $268,246 | $141,229 | $127,017 |
| 2016 | $3,211 | $257,832 | $135,746 | $122,086 |
| 2015 | $3,166 | $253,960 | $133,707 | $120,253 |
| 2014 | $3,183 | $248,986 | $131,088 | $117,898 |
Source: Public Records
Map
Nearby Homes
- 2273 Highbury Ave
- 2334 Highbury Ave
- 2325 Highbury Ave Unit 59
- 1937 Charnwood Ave
- 3008 Parkview Dr
- 2323 Warwick Ave
- 2917 W Hellman Ave
- 2912 W Hellman Ave
- 5306 Borland Rd
- 1417 Milton Ave
- 2204 Orange Grove Ave Unit A,B,C
- 5200 Bohlig Rd
- 2912 Covina St
- 5150 Valley Blvd
- 2000 La Paloma Ave
- 2920 Covina St
- 5274 Ithaca Ave
- 1705 S Fremont Ave
- 2121 El Paseo
- 2901 Front St
- 2292 Highbury Ave
- 2280 Highbury Ave
- 2276 Highbury Ave
- 2272 Highbury Ave
- 2300 Highbury Ave
- 2269 Highbury Ave
- 2277 Highbury Ave
- 2268 Highbury Ave
- 2265 Highbury Ave
- 2261 Highbury Ave
- 2306 Highbury Ave
- 2255 Highbury Ave
- 2314 Highbury Ave
- 2272 Vandalia Ave
- 2266 Vandalia Ave
- 2276 Vandalia Ave
- 2262 Vandalia Ave
- 2258 Vandalia Ave
- 2318 Highbury Ave
- 2254 Vandalia Ave