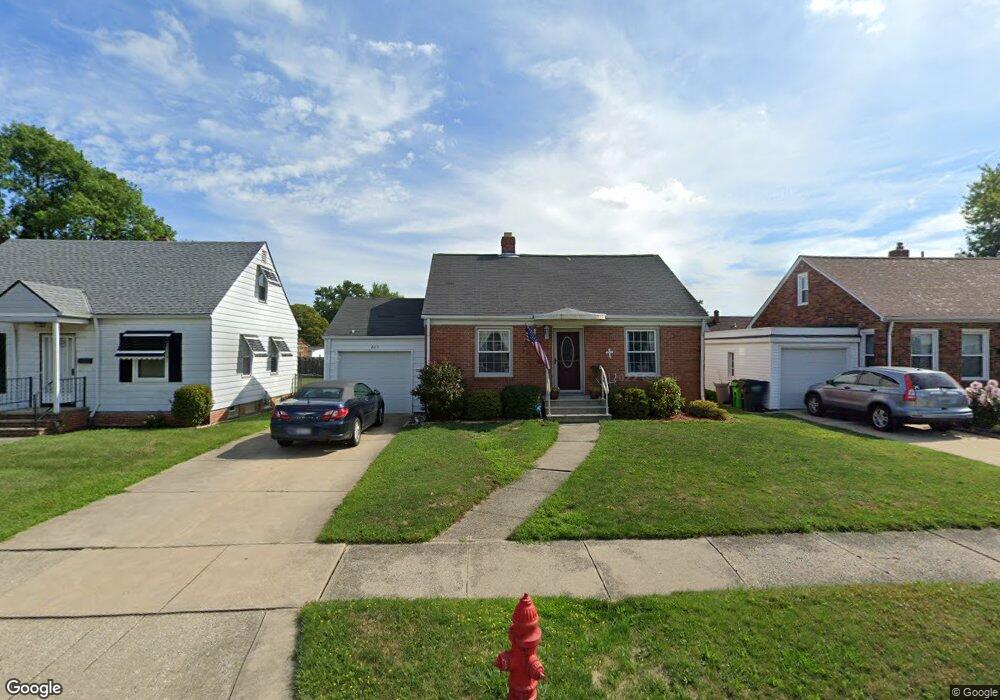
229 E 326th St Willowick, OH 44095
Estimated Value: $171,715 - $201,000
3
Beds
1
Bath
783
Sq Ft
$232/Sq Ft
Est. Value
About This Home
This home is located at 229 E 326th St, Willowick, OH 44095 and is currently estimated at $181,929, approximately $232 per square foot. 229 E 326th St is a home located in Lake County with nearby schools including Royalview Elementary School, Willowick Middle School, and North High School.
Ownership History
Date
Name
Owned For
Owner Type
Purchase Details
Closed on
Jan 31, 2024
Sold by
Buza Tammy L
Bought by
Tammy Buza Trust and Buza
Current Estimated Value
Purchase Details
Closed on
Jan 20, 2012
Sold by
Gonzalez Robert
Bought by
Buza Tammy L
Purchase Details
Closed on
Jul 30, 2001
Sold by
Liebhardt Thomas G and Liebhardt Karlyn L
Bought by
Buza Tammy L
Home Financials for this Owner
Home Financials are based on the most recent Mortgage that was taken out on this home.
Original Mortgage
$90,335
Interest Rate
7.14%
Mortgage Type
FHA
Purchase Details
Closed on
Aug 2, 1996
Sold by
Haller Frank M
Bought by
Liebhardt Thomas G and Liebhardt Karlyn L
Home Financials for this Owner
Home Financials are based on the most recent Mortgage that was taken out on this home.
Original Mortgage
$87,700
Interest Rate
8.33%
Mortgage Type
New Conventional
Create a Home Valuation Report for This Property
The Home Valuation Report is an in-depth analysis detailing your home's value as well as a comparison with similar homes in the area
Home Values in the Area
Average Home Value in this Area
Purchase History
| Date | Buyer | Sale Price | Title Company |
|---|---|---|---|
| Tammy Buza Trust | -- | None Listed On Document | |
| Buza Tammy L | -- | Attorney | |
| Buza Tammy L | $119,000 | Enterprise Title Agency Inc | |
| Liebhardt Thomas G | $95,300 | -- |
Source: Public Records
Mortgage History
| Date | Status | Borrower | Loan Amount |
|---|---|---|---|
| Previous Owner | Buza Tammy L | $90,335 | |
| Previous Owner | Liebhardt Thomas G | $87,700 |
Source: Public Records
Tax History
| Year | Tax Paid | Tax Assessment Tax Assessment Total Assessment is a certain percentage of the fair market value that is determined by local assessors to be the total taxable value of land and additions on the property. | Land | Improvement |
|---|---|---|---|---|
| 2025 | -- | $60,070 | $11,350 | $48,720 |
| 2024 | -- | $60,070 | $11,350 | $48,720 |
| 2023 | $3,944 | $38,070 | $9,860 | $28,210 |
| 2022 | $2,754 | $38,070 | $9,860 | $28,210 |
| 2021 | $2,765 | $38,070 | $9,860 | $28,210 |
| 2020 | $2,440 | $30,460 | $7,890 | $22,570 |
| 2019 | $2,287 | $30,460 | $7,890 | $22,570 |
| 2018 | $2,261 | $34,070 | $13,720 | $20,350 |
| 2017 | $2,640 | $34,070 | $13,720 | $20,350 |
| 2016 | $2,635 | $34,070 | $13,720 | $20,350 |
| 2015 | $2,581 | $34,070 | $13,720 | $20,350 |
| 2014 | $2,467 | $34,070 | $13,720 | $20,350 |
| 2013 | $2,468 | $34,070 | $13,720 | $20,350 |
Source: Public Records
Map
Nearby Homes
- 32321 Lake Shore Blvd
- 280 E 328th St
- 306 E 323rd St
- 352 E 328th St
- V/L 331st St
- 531 E 331st St
- 390 E 332nd St
- 164 E 317th St
- 276 E 317th St
- 296 E 317th St
- 33378 Lake Shore Blvd
- 33418 Lake Shore Blvd
- 1138 E 331st St
- 344 E 315th St
- 32540 Willowick Dr
- 483 E 330th St
- 33661 Kenilworth Rd
- 660 Rokeby Rd
- 31931 Dickerson Rd
- 32113 Dickerson Rd
- 235 E 326th St
- 223 E 326th St
- 241 E 326th St
- 217 E 326th St
- 230 E 327th St
- 236 E 327th St
- 226 E 327th St
- 247 E 326th St
- 240 E 327th St
- 220 E 327th St
- 230 E 326th St
- 236 E 326th St
- 224 E 326th St
- 32606 Lake Shore Blvd
- 246 E 327th St
- 242 E 326th St
- 32612 Lake Shore Blvd
- 253 E 326th St
- 32506 Lake Shore Blvd
- 32618 Lake Shore Blvd
Your Personal Tour Guide
Ask me questions while you tour the home.