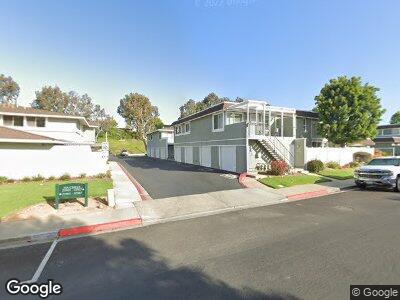
22941 Via Cereza Unit 1D Mission Viejo, CA 92691
Estimated Value: $539,000 - $588,000
2
Beds
1
Bath
864
Sq Ft
$648/Sq Ft
Est. Value
About This Home
This home is located at 22941 Via Cereza Unit 1D, Mission Viejo, CA 92691 and is currently estimated at $559,920, approximately $648 per square foot. 22941 Via Cereza Unit 1D is a home located in Orange County with nearby schools including Glen Yermo Elementary School, Los Alisos Intermediate School, and Mission Viejo High School.
Ownership History
Date
Name
Owned For
Owner Type
Purchase Details
Closed on
Jul 8, 2005
Sold by
Kalajian John
Bought by
Kalajian John H and Kalajian Susan Claire
Current Estimated Value
Home Financials for this Owner
Home Financials are based on the most recent Mortgage that was taken out on this home.
Original Mortgage
$111,500
Outstanding Balance
$61,833
Interest Rate
5.76%
Mortgage Type
Unknown
Estimated Equity
$497,609
Purchase Details
Closed on
Nov 24, 1999
Sold by
Kalajian Sue
Bought by
Kalajian John
Home Financials for this Owner
Home Financials are based on the most recent Mortgage that was taken out on this home.
Original Mortgage
$100,800
Interest Rate
7.25%
Purchase Details
Closed on
Oct 29, 1999
Sold by
Schaffer Renelle L
Bought by
Kalajian John
Home Financials for this Owner
Home Financials are based on the most recent Mortgage that was taken out on this home.
Original Mortgage
$100,800
Interest Rate
7.25%
Create a Home Valuation Report for This Property
The Home Valuation Report is an in-depth analysis detailing your home's value as well as a comparison with similar homes in the area
Home Values in the Area
Average Home Value in this Area
Purchase History
| Date | Buyer | Sale Price | Title Company |
|---|---|---|---|
| Kalajian John H | -- | -- | |
| Kalajian John | -- | -- | |
| Kalaiian John | $126,000 | Landwood Title |
Source: Public Records
Mortgage History
| Date | Status | Borrower | Loan Amount |
|---|---|---|---|
| Open | Kalajian John H | $111,500 | |
| Closed | Kalajian John | $100,940 | |
| Previous Owner | Kalaiian John | $100,800 |
Source: Public Records
Tax History Compared to Growth
Tax History
| Year | Tax Paid | Tax Assessment Tax Assessment Total Assessment is a certain percentage of the fair market value that is determined by local assessors to be the total taxable value of land and additions on the property. | Land | Improvement |
|---|---|---|---|---|
| 2024 | $1,968 | $189,849 | $123,143 | $66,706 |
| 2023 | $1,922 | $186,127 | $120,728 | $65,399 |
| 2022 | $1,888 | $182,478 | $118,361 | $64,117 |
| 2021 | $1,850 | $178,900 | $116,040 | $62,860 |
| 2020 | $1,834 | $177,066 | $114,850 | $62,216 |
| 2019 | $1,797 | $173,595 | $112,598 | $60,997 |
| 2018 | $1,764 | $170,192 | $110,391 | $59,801 |
| 2017 | $1,729 | $166,855 | $108,226 | $58,629 |
| 2016 | $1,700 | $163,584 | $106,104 | $57,480 |
| 2015 | $1,680 | $161,127 | $104,510 | $56,617 |
| 2014 | $1,643 | $157,971 | $102,463 | $55,508 |
Source: Public Records
Map
Nearby Homes
- 22963 Via Cereza Unit 3A
- 26201 Via Roble Unit 1a
- 22792 La Quinta Dr
- 26258 Via Roble Unit 36
- 26148 Via Pera Unit 4
- 25957 Via Pera Unit C4
- 26284 Via Roble Unit 2
- 22671 Cheryl Way
- 26428 Via Roble
- 26436 Via Roble Unit 35
- 22602 Manalastas Dr
- 22612 Rockford Dr
- 26065 Las Flores Unit C
- 22492 Eloise Dr
- 26205 La Real Unit C
- 22682 Revere Rd
- 25735 Williamsburg Ct
- 23351 La Crescenta Unit B311
- 23391 La Crescenta Unit 270C
- 22471 Rippling Brook
- 22941 Via Cereza Unit 1D
- 22943 Via Cereza
- 22942 Via Cereza
- 22944 Via Cereza Unit 2e
- 22944 Via Cereza
- 22945 Via Cereza
- 22937 Via Cereza
- 22947 Via Cereza Unit 4D
- 22947 Via Cereza
- 22935 Via Cereza Unit 3G
- 22933 Via Cereza
- 22951 Via Cereza Unit E1
- 22931 Via Cereza Unit G1
- 22953 Via Cereza Unit 3
- 22955 Via Cereza Unit 2E
- 22955 Via Cereza
- 22927 Via Cereza Unit F4
- 22957 Via Cereza Unit 4E
- 22925 Via Cereza Unit 3F
- 22925 Via Cereza