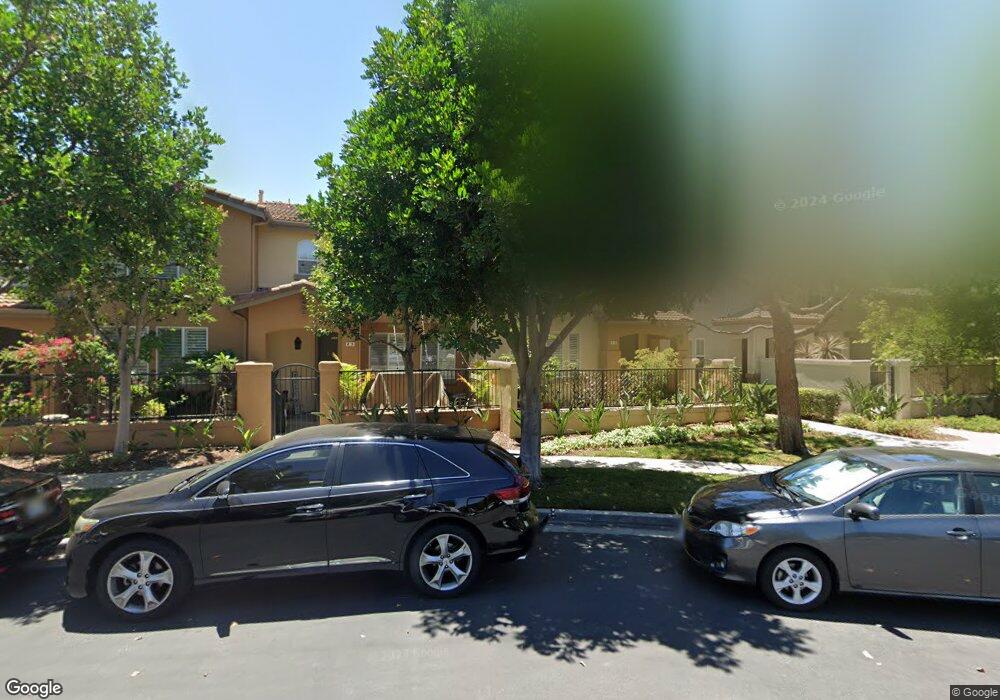
23 Crestline Unit 98 Irvine, CA 92602
Lower Peters Canyon NeighborhoodEstimated Value: $1,086,467 - $1,187,000
3
Beds
3
Baths
1,549
Sq Ft
$743/Sq Ft
Est. Value
About This Home
This home is located at 23 Crestline Unit 98, Irvine, CA 92602 and is currently estimated at $1,151,367, approximately $743 per square foot. 23 Crestline Unit 98 is a home located in Orange County with nearby schools including Myford Elementary School, Pioneer Middle School, and Arnold O. Beckman High School.
Ownership History
Date
Name
Owned For
Owner Type
Purchase Details
Closed on
May 12, 2016
Sold by
Aluvala Umashankar and Aluvala Neeraja
Bought by
Aluvala Umashankar and Aluvala Neeraja
Current Estimated Value
Purchase Details
Closed on
Jul 24, 2008
Sold by
Sanchez Socorro and Sanchez Joann
Bought by
Aluvala Umashankar and Punna Neeraja
Home Financials for this Owner
Home Financials are based on the most recent Mortgage that was taken out on this home.
Original Mortgage
$416,000
Outstanding Balance
$272,426
Interest Rate
6.37%
Mortgage Type
Purchase Money Mortgage
Estimated Equity
$878,941
Purchase Details
Closed on
Apr 19, 2002
Sold by
William Lyon Homes Inc
Bought by
Sanchez Socorro and Sanchez Joann
Home Financials for this Owner
Home Financials are based on the most recent Mortgage that was taken out on this home.
Original Mortgage
$249,250
Interest Rate
7.13%
Create a Home Valuation Report for This Property
The Home Valuation Report is an in-depth analysis detailing your home's value as well as a comparison with similar homes in the area
Home Values in the Area
Average Home Value in this Area
Purchase History
| Date | Buyer | Sale Price | Title Company |
|---|---|---|---|
| Aluvala Umashankar | -- | None Available | |
| Aluvala Umashankar | $520,000 | Western Resources Title Co | |
| Sanchez Socorro | $312,000 | Fidelity National Title |
Source: Public Records
Mortgage History
| Date | Status | Borrower | Loan Amount |
|---|---|---|---|
| Open | Aluvala Umashankar | $416,000 | |
| Previous Owner | Sanchez Socorro | $249,250 |
Source: Public Records
Tax History
| Year | Tax Paid | Tax Assessment Tax Assessment Total Assessment is a certain percentage of the fair market value that is determined by local assessors to be the total taxable value of land and additions on the property. | Land | Improvement |
|---|---|---|---|---|
| 2025 | $7,445 | $669,628 | $429,864 | $239,764 |
| 2024 | $7,445 | $656,499 | $421,436 | $235,063 |
| 2023 | $7,302 | $643,627 | $413,173 | $230,454 |
| 2022 | $7,162 | $631,007 | $405,071 | $225,936 |
| 2021 | $7,125 | $618,635 | $397,129 | $221,506 |
| 2020 | $7,265 | $612,292 | $393,057 | $219,235 |
| 2019 | $7,109 | $600,287 | $385,350 | $214,937 |
| 2018 | $6,963 | $588,517 | $377,794 | $210,723 |
| 2017 | $6,802 | $576,978 | $370,386 | $206,592 |
| 2016 | $6,612 | $565,665 | $363,123 | $202,542 |
| 2015 | $6,453 | $557,169 | $357,669 | $199,500 |
| 2014 | $6,244 | $536,975 | $350,662 | $186,313 |
Source: Public Records
Map
Nearby Homes
- 14 Sorenson
- 2920 Player Ln Unit 1
- 33 Visalia
- 2894 Player Ln
- 2827 Player Ln
- 0 0 Unit 202512306
- 42 Topanga
- 2800 Keller Dr Unit 80
- 9 Bonsall Unit 61
- 2 Dos Rios
- 18 Bel Spring
- 59 Boulder Creek Way
- 2960 Champion Way Unit 1407
- 12891 Mackenzie Dr Unit 86
- 19 Inglenook
- 33 Modesto
- 22 Modesto
- 31 Dinuba
- 23 Red Coat Place
- 6 Napa
- 27 Crestline Unit 96
- 17 Ballard Unit 91
- 17 Crestline Unit 101
- 18 Crestline Unit 106
- 15 Ballard Unit 90
- 15 Ballard
- 23 Ballard Unit 94
- 23 Ballard
- 19 Ballard Unit 92
- 25 Ballard Unit 95
- 21 Ballard Unit 93
- 5 Emory Unit 88
- 7 Emory Unit 87
- 7 Emory
- 11 Emory
- 18 Haverhill Unit 118
- 11 Weathersfield Unit 5
- 10 Crestline Unit 110
- 12 Weathersfield
- 8 Weathersfield Unit 11
Your Personal Tour Guide
Ask me questions while you tour the home.