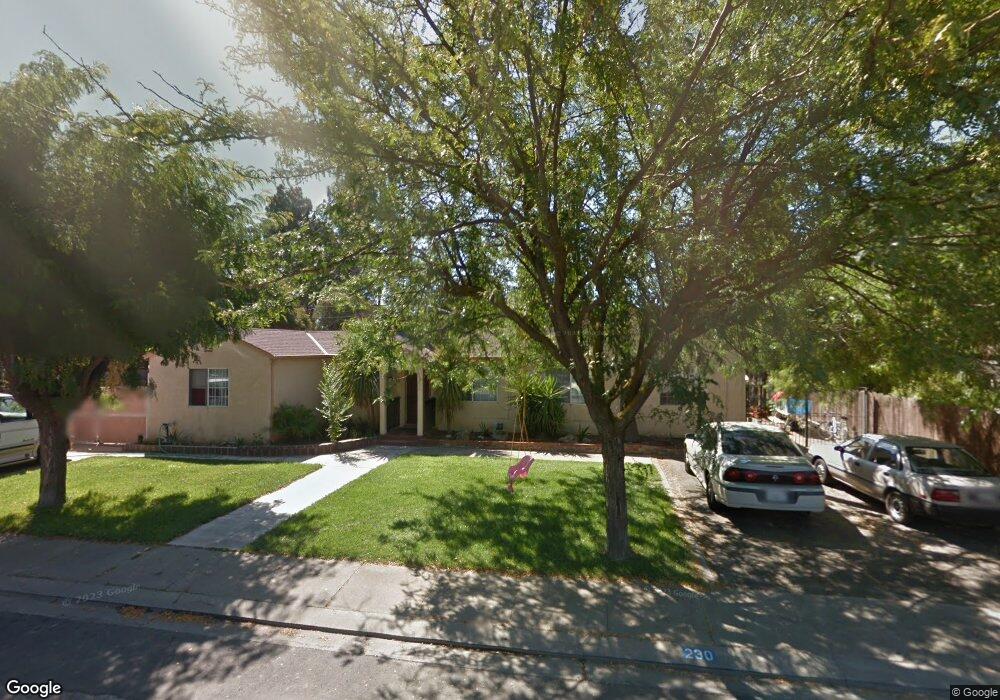
230 Northmead Way Patterson, CA 95363
Estimated Value: $283,000 - $449,006
3
Beds
2
Baths
1,416
Sq Ft
$275/Sq Ft
Est. Value
About This Home
This home is located at 230 Northmead Way, Patterson, CA 95363 and is currently estimated at $389,002, approximately $274 per square foot. 230 Northmead Way is a home located in Stanislaus County with nearby schools including Northmead Elementary School, Creekside Middle School, and Patterson High School.
Ownership History
Date
Name
Owned For
Owner Type
Purchase Details
Closed on
Apr 28, 2004
Sold by
Mariscal George P and Mariscal Leticia
Bought by
Murillo Jose L and Murillo Norma
Current Estimated Value
Home Financials for this Owner
Home Financials are based on the most recent Mortgage that was taken out on this home.
Original Mortgage
$228,000
Outstanding Balance
$102,143
Interest Rate
4.87%
Mortgage Type
Purchase Money Mortgage
Estimated Equity
$286,859
Purchase Details
Closed on
Dec 6, 2000
Sold by
Deanda Martin C and Deanda Ofelia
Bought by
Mariscal George P and Mariscal Leticia
Home Financials for this Owner
Home Financials are based on the most recent Mortgage that was taken out on this home.
Original Mortgage
$132,000
Interest Rate
7.67%
Purchase Details
Closed on
Nov 8, 1999
Sold by
Banda Julio P
Bought by
Mariscal George P and Mariscal Leticia
Home Financials for this Owner
Home Financials are based on the most recent Mortgage that was taken out on this home.
Original Mortgage
$85,500
Interest Rate
7.82%
Create a Home Valuation Report for This Property
The Home Valuation Report is an in-depth analysis detailing your home's value as well as a comparison with similar homes in the area
Home Values in the Area
Average Home Value in this Area
Purchase History
| Date | Buyer | Sale Price | Title Company |
|---|---|---|---|
| Murillo Jose L | $240,000 | Old Republic | |
| Mariscal George P | -- | Fidelity National Title Co | |
| Mariscal George P | $95,000 | Chicago Title Co |
Source: Public Records
Mortgage History
| Date | Status | Borrower | Loan Amount |
|---|---|---|---|
| Open | Murillo Jose L | $228,000 | |
| Previous Owner | Mariscal George P | $132,000 | |
| Previous Owner | Mariscal George P | $85,500 |
Source: Public Records
Tax History Compared to Growth
Tax History
| Year | Tax Paid | Tax Assessment Tax Assessment Total Assessment is a certain percentage of the fair market value that is determined by local assessors to be the total taxable value of land and additions on the property. | Land | Improvement |
|---|---|---|---|---|
| 2024 | $6,428 | $334,519 | $170,744 | $163,775 |
| 2023 | $6,339 | $327,961 | $167,397 | $160,564 |
| 2022 | $6,118 | $321,531 | $164,115 | $157,416 |
| 2021 | $6,088 | $315,228 | $160,898 | $154,330 |
| 2020 | $6,023 | $311,997 | $159,249 | $152,748 |
| 2019 | $5,968 | $305,880 | $156,127 | $149,753 |
| 2018 | $5,510 | $274,500 | $140,000 | $134,500 |
| 2017 | $2,524 | $225,500 | $105,000 | $120,500 |
| 2016 | $2,361 | $212,500 | $60,000 | $152,500 |
| 2015 | $1,984 | $178,000 | $24,000 | $154,000 |
| 2014 | $1,654 | $148,500 | $20,000 | $128,500 |
Source: Public Records
Map
Nearby Homes