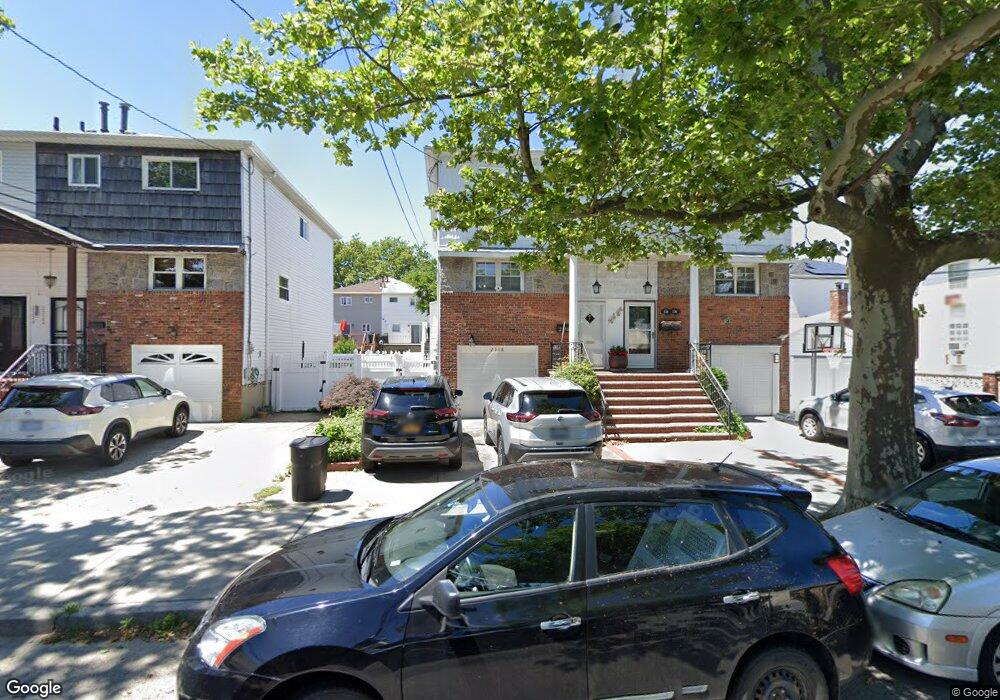
2318 E 71st St Brooklyn, NY 11234
Bergen Beach NeighborhoodEstimated Value: $831,839 - $950,000
Studio
--
Bath
1,665
Sq Ft
$549/Sq Ft
Est. Value
About This Home
This home is located at 2318 E 71st St, Brooklyn, NY 11234 and is currently estimated at $913,710, approximately $548 per square foot. 2318 E 71st St is a home located in Kings County with nearby schools including P.S. 312 Bergen Beach, James Madison High School, and Success Academy Charter School - Bergen Beach.
Ownership History
Date
Name
Owned For
Owner Type
Purchase Details
Closed on
Jan 21, 2015
Sold by
Hovell Beverly
Bought by
Hovell Future Decisions Trust Dated 1 and Hovell, Trustee, Beverly
Current Estimated Value
Purchase Details
Closed on
Sep 12, 1997
Sold by
Steingart Edward
Bought by
Hovell Richard J and Hovell Beverly
Home Financials for this Owner
Home Financials are based on the most recent Mortgage that was taken out on this home.
Original Mortgage
$172,500
Interest Rate
7.48%
Create a Home Valuation Report for This Property
The Home Valuation Report is an in-depth analysis detailing your home's value as well as a comparison with similar homes in the area
Home Values in the Area
Average Home Value in this Area
Purchase History
| Date | Buyer | Sale Price | Title Company |
|---|---|---|---|
| Hovell Future Decisions Trust Dated 1 | -- | -- | |
| Hovell Richard J | $247,500 | Commonwealth Land Title Ins |
Source: Public Records
Mortgage History
| Date | Status | Borrower | Loan Amount |
|---|---|---|---|
| Previous Owner | Hovell Richard J | $172,500 |
Source: Public Records
Tax History
| Year | Tax Paid | Tax Assessment Tax Assessment Total Assessment is a certain percentage of the fair market value that is determined by local assessors to be the total taxable value of land and additions on the property. | Land | Improvement |
|---|---|---|---|---|
| 2025 | $6,720 | $49,500 | $12,120 | $37,380 |
| 2024 | $6,720 | $42,060 | $12,120 | $29,940 |
| 2023 | $6,864 | $51,180 | $12,120 | $39,060 |
| 2022 | $6,264 | $49,800 | $12,120 | $37,680 |
| 2021 | $6,169 | $49,920 | $12,120 | $37,800 |
| 2019 | $5,687 | $42,660 | $12,120 | $30,540 |
| 2018 | $5,471 | $34,871 | $8,996 | $25,875 |
| 2017 | $5,473 | $32,898 | $9,116 | $23,782 |
| 2016 | $4,999 | $31,036 | $9,513 | $21,523 |
| 2015 | $3,587 | $29,280 | $13,440 | $15,840 |
| 2014 | $3,587 | $29,280 | $13,440 | $15,840 |
Source: Public Records
Map
Nearby Homes
- 2239 E 70th St
- 2248 E 70th St
- 2246 E 70th St
- 2233 E 72nd St
- 7417 Avenue W
- 2427 E 72nd St
- 2172 E 72nd St
- 2447 E 71st St
- 2310 Bergen Ave
- 2346 Bergen Ave
- 2136 E 69th St
- 2115 E 70th St
- 2134 E 74th St Unit 2138
- 2150 Royce St
- 2102 E 73rd St
- 2345 E 65th St
- 255 Mayfair Dr N
- 2321 E 64th St
- 2063 E 71st St
- 2072 E 68th St
Your Personal Tour Guide
Ask me questions while you tour the home.