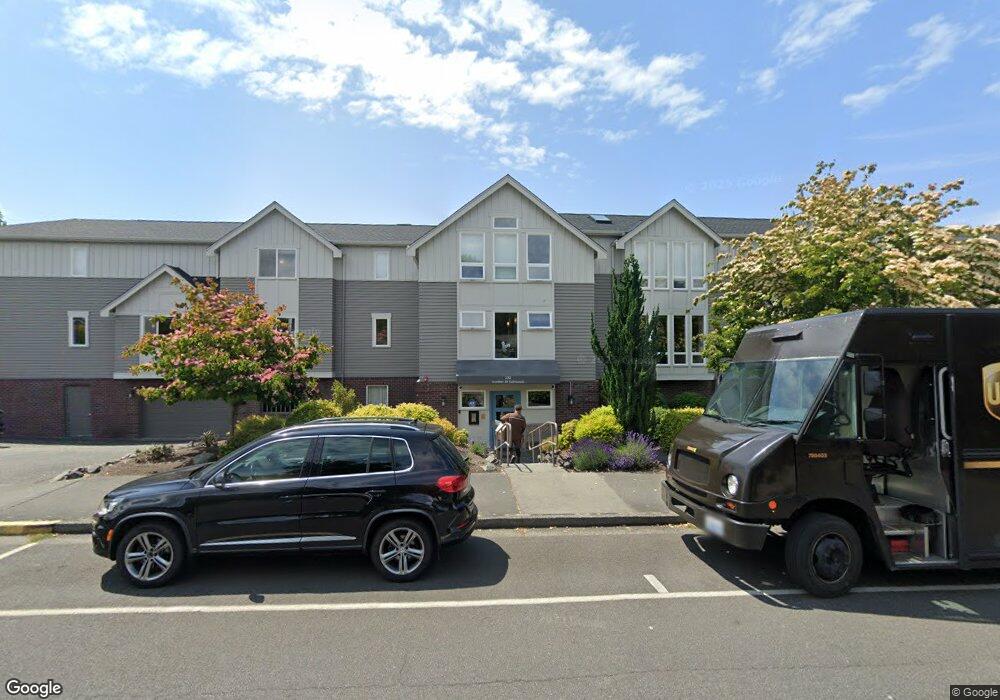
232 4th Ave S Unit 204 Edmonds, WA 98020
Downtown Edmonds NeighborhoodEstimated Value: $673,843 - $700,000
2
Beds
2
Baths
1,081
Sq Ft
$636/Sq Ft
Est. Value
About This Home
This home is located at 232 4th Ave S Unit 204, Edmonds, WA 98020 and is currently estimated at $687,211, approximately $635 per square foot. 232 4th Ave S Unit 204 is a home located in Snohomish County with nearby schools including Sherwood Elementary School, College Place Middle School, and Edmonds-Woodway High School.
Ownership History
Date
Name
Owned For
Owner Type
Purchase Details
Closed on
Sep 5, 1995
Sold by
Erhardt Michael Inc
Bought by
Piekarski June E and June E Piekarski Revocable Trust
Current Estimated Value
Purchase Details
Closed on
Aug 22, 1995
Sold by
Erhardt/Michel Inc
Bought by
Rohrbach Carroll B and Rohrbach Rowena B
Purchase Details
Closed on
Sep 26, 1994
Sold by
Michel Robin W and Michel Karen E
Bought by
Erhardt/Michel Inc
Home Financials for this Owner
Home Financials are based on the most recent Mortgage that was taken out on this home.
Original Mortgage
$1,100,000
Interest Rate
8.58%
Purchase Details
Closed on
Jan 26, 1994
Sold by
Hammond Gordon L and Hammond Lavida
Bought by
Michel Robin W and Michel Karen E
Home Financials for this Owner
Home Financials are based on the most recent Mortgage that was taken out on this home.
Original Mortgage
$265,000
Interest Rate
7.21%
Mortgage Type
Seller Take Back
Create a Home Valuation Report for This Property
The Home Valuation Report is an in-depth analysis detailing your home's value as well as a comparison with similar homes in the area
Home Values in the Area
Average Home Value in this Area
Purchase History
| Date | Buyer | Sale Price | Title Company |
|---|---|---|---|
| Piekarski June E | $165,000 | First American Title | |
| Rohrbach Carroll B | $176,000 | First American Title | |
| Erhardt/Michel Inc | -- | First American Title | |
| Michel Robin W | $400,000 | -- |
Source: Public Records
Mortgage History
| Date | Status | Borrower | Loan Amount |
|---|---|---|---|
| Previous Owner | Erhardt/Michel Inc | $1,100,000 | |
| Previous Owner | Michel Robin W | $265,000 |
Source: Public Records
Tax History Compared to Growth
Tax History
| Year | Tax Paid | Tax Assessment Tax Assessment Total Assessment is a certain percentage of the fair market value that is determined by local assessors to be the total taxable value of land and additions on the property. | Land | Improvement |
|---|---|---|---|---|
| 2025 | $4,491 | $608,000 | $250,000 | $358,000 |
| 2024 | $4,491 | $631,200 | $250,000 | $381,200 |
| 2023 | $4,137 | $602,600 | $250,000 | $352,600 |
| 2022 | $4,376 | $524,000 | $210,000 | $314,000 |
| 2020 | $4,770 | $510,800 | $210,000 | $300,800 |
| 2019 | $3,729 | $402,200 | $210,000 | $192,200 |
| 2018 | $3,628 | $338,100 | $210,000 | $128,100 |
| 2017 | $3,189 | $311,000 | $92,500 | $218,500 |
| 2016 | $2,898 | $280,000 | $74,000 | $206,000 |
| 2015 | $2,798 | $254,500 | $68,500 | $186,000 |
| 2013 | $2,570 | $220,500 | $75,500 | $145,000 |
Source: Public Records
Map
Nearby Homes
- 233 3rd Ave S Unit 304
- 335 3rd Ave S Unit 203
- 960 5th Ave S Unit 208
- 621 Daley St
- 816 Walnut St
- 1071 4th Ave S Unit 302
- 603 7th Ave N Unit A306
- 1110 5th Ave S Unit 204
- 609 7th Ave N Unit B204
- 611 3rd Ave N
- 55 Pine St Unit 203
- 71 Pine St Unit 212
- 71 Pine St Unit 302
- 1140 3rd Ave S
- 50 Pine St Unit 103
- 550 Elm Way Unit 408
- 637 Elm Place
- 1021 Walnut St
- 9533 Bowdoin Way
- 1221 Coronado Place
- 232 4th Ave S Unit 306
- 232 4th Ave S Unit 305
- 232 4th Ave S Unit 304
- 232 4th Ave S Unit 303
- 232 4th Ave S Unit 302
- 232 4th Ave S Unit 301
- 232 4th Ave S Unit 205
- 232 4th Ave S Unit 203
- 232 4th Ave S Unit 202
- 232 4th Ave S Unit 201
- 232 4th Ave S Unit 101
- 232 4th Ave S
- 220 4th Ave S
- 242 4th Ave S Unit UNT
- 242 4th Ave S Unit 6
- 242 4th Ave S Unit 5
- 242 4th Ave S Unit 4
- 242 4th Ave S Unit 3
- 242 4th Ave S Unit 2
- 242 4th Ave S Unit 1