2323 E 70th St Brooklyn, NY 11234
Bergen Beach NeighborhoodEstimated Value: $852,934 - $967,000
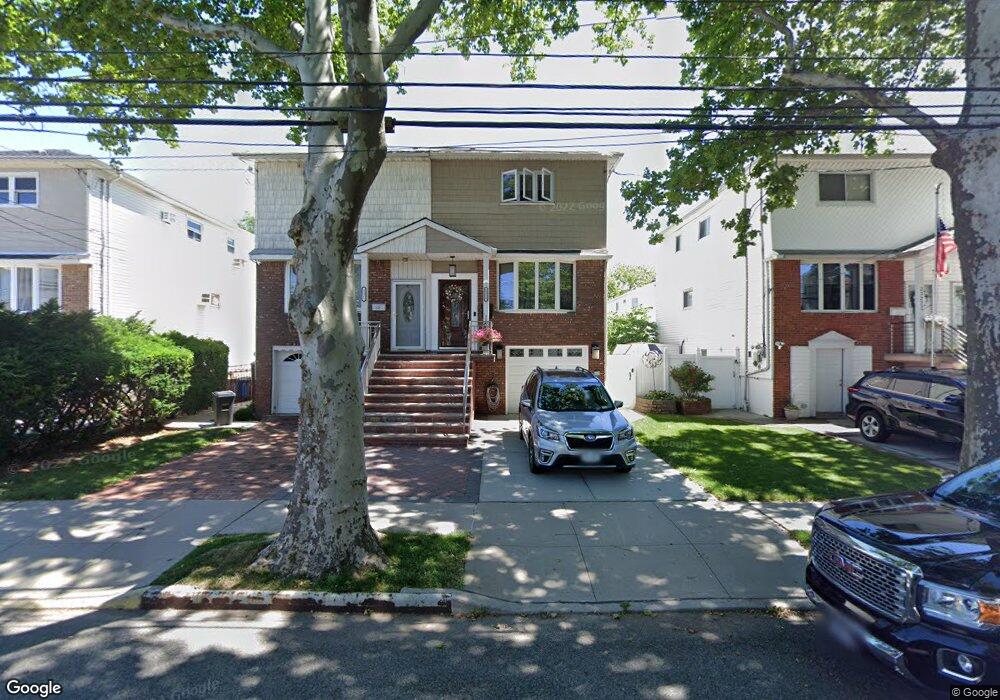
About This Home
This home is located at 2323 E 70th St, Brooklyn, NY 11234 and is currently estimated at $920,984, approximately $553 per square foot. 2323 E 70th St is a home located in Kings County with nearby schools including P.S. 312 Bergen Beach, James Madison High School, and Success Academy Charter School - Bergen Beach.
Ownership History
We collect this data history from publicly available records. To have your information removed, we recommend requesting removal directly through your county’s website.
Purchase Details
Home Financials for this Owner
Home Financials are based on the most recent Mortgage that was taken out on this home.Home Values in the Area
Average Home Value in this Area
Purchase History
We collect this data history from publicly available records. To have your information removed, we recommend requesting removal directly through your county’s website.
| Date | Buyer | Sale Price | Title Company |
|---|---|---|---|
| $565,000 | -- |
Mortgage History
We collect this data history from publicly available records. To have your information removed, we recommend requesting removal directly through your county’s website.
| Date | Status | Borrower | Loan Amount |
|---|---|---|---|
| Open | $513,585 |
Tax History
We collect this data history from publicly available records. To have your information removed, we recommend requesting removal directly through your county’s website.
| Year | Tax Paid | Tax Assessment Tax Assessment Total Assessment is a certain percentage of the fair market value that is determined by local assessors to be the total taxable value of land and additions on the property. | Land | Improvement |
|---|---|---|---|---|
| 2026 | $8,201 | $54,060 | $12,060 | $42,000 |
| 2025 | $8,203 | $50,460 | $12,060 | $38,400 |
| 2024 | $8,203 | $42,240 | $12,060 | $30,180 |
| 2023 | $8,232 | $51,420 | $12,060 | $39,360 |
| 2022 | $7,610 | $51,600 | $12,060 | $39,540 |
| 2021 | $7,558 | $50,880 | $12,060 | $38,820 |
| 2020 | $3,831 | $46,920 | $12,060 | $34,860 |
| 2019 | $7,072 | $42,660 | $12,060 | $30,600 |
| 2018 | $6,825 | $34,943 | $9,169 | $25,774 |
| 2017 | $6,420 | $32,966 | $9,267 | $23,699 |
| 2016 | $5,907 | $31,100 | $9,471 | $21,629 |
| 2015 | $4,087 | $29,340 | $13,380 | $15,960 |
| 2014 | $4,087 | $29,340 | $13,380 | $15,960 |
Map
- 2334 E 72nd St
- 2248 E 70th St
- 2246 E 70th St
- 2223 E 70th St
- 2423 E 69th St
- 2427 E 72nd St
- 2177 E 69th St
- 2224 E 74th St
- 7417 Avenue W
- 2310 E 66th St
- 2151 E 71st St Unit 2155
- 2309 E 65th St
- 2310 Bergen Ave
- 2346 Bergen Ave
- 2136 E 69th St
- 2256 Bergen Ave
- 2345 E 65th St
- 255 Mayfair Dr N
- 2115 E 70th St
- 2321 E 64th St
Ask me questions while you tour the home.